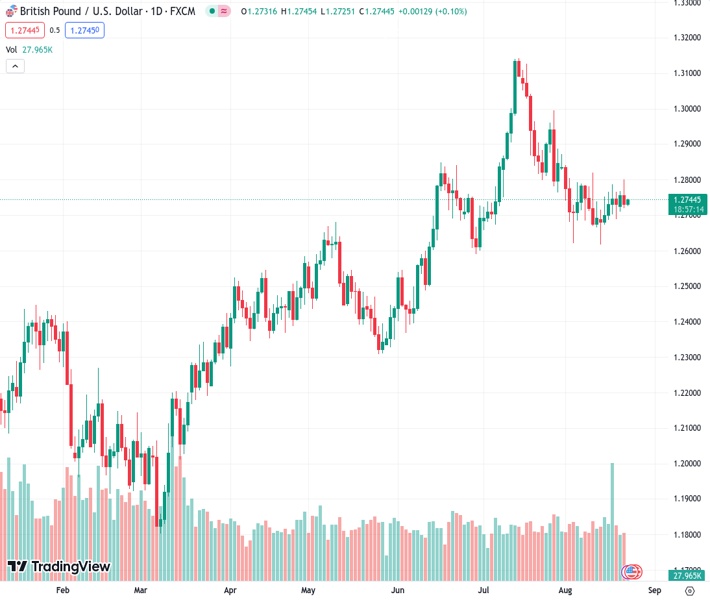
The GBPUSD pair, at a rate of 1.27430, stops the decrease in value seen overnight and receives a boost from a small decline in the value of the USD.
…
This is a premium post.
[s2If !current_user_can(access_s2member_level4)]Please register for FREE REGISTER to read full post below containing analysis. In case of any error or you think you are not able to read the full post below, please email us at support#nehcap.com [lwa][/s2If] [s2If current_user_can(access_s2member_level1)]
- GBP/USD stalls the overnight pullback and draws support from a modest USD downtick.
The pair currently trades last at 1.27430.
The previous day high was 1.28 while the previous day low was 1.2718. The daily 38.2% Fib levels comes at 1.275, expected to provide resistance. Similarly, the daily 61.8% fib level is at 1.2769, expected to provide resistance.
The GBP/USD pair struggles to gain any meaningful traction and oscillates in a narrow trading band, below mid-1.2700s through the Asian session on Wednesday. Spot prices, however, seem to have stalled the overnight retracement slide from the 1.2800 mark, or a one-and-half-week high, and remain at the mercy of the US Dollar (USD) price dynamics.
A modest downtick in the US Treasury bond yields fails to assist the USD Index (DXY), which tracks the Greenback against a basket of currencies, to capitalize on the gains registered on Tuesday to its highest level since July 12. Apart from this, a positive tone around the US equity futures undermines the safe-haven buck and acts as a tailwind for the GBP/USD pair. The British Pound (GBP) draws additional support from rising bets for more rate hikes by the Bank of England (BoE).
In fact, the current market pricing indicates a more than 80% chance of a 25 bps lift-off at the next BoE meeting in September. The bets were lifted by the fact that wages in the UK touched a new record growth rate in the second quarter, which adds to worries about long-term inflation even after 14 consecutive rate hikes to a 15-year high in August. Adding to this, the upbeat UK GDP report and slightly higher UK CPI print support prospects for further policy tightening by the BoE.
The Federal Reserve (Fed), meanwhile, is also expected to stick to its hawkish stance and keep interest rates higher for longer. Apart from this, concerns about the worsening economic conditions in China should contribute to limiting the downside for the buck and capping gains for the GBP/USD pair. Traders also seem reluctant to place aggressive bets ahead of the crucial Jackson Hole Symposium, where comments by central banks should infuse volatility in the markets.
In the meantime, Wednesday’s release of the flash PMI prints from the UK and the US will be looked upon for short-term trading opportunities. The data will provide fresh insight into the overall economic health and whether the respective central banks can afford to increase interest rates further, which, in turn, should influence the GBP/USD pair. The fundamental backdrop, meanwhile, makes it prudent to wait for strong follow-through buying before positioning for further gains.
Technical Levels: Supports and Resistances
GBPUSD currently trading at 1.2744 at the time of writing. Pair opened at 1.2732 and is trading with a change of 0.09 % .
| Overview | Overview.1 | |
|---|---|---|
| 0 | Today last price | 1.2744 |
| 1 | Today Daily Change | 0.0012 |
| 2 | Today Daily Change % | 0.0900 |
| 3 | Today daily open | 1.2732 |
The pair is trading below its 20 Daily moving average @ 1.2754, below its 50 Daily moving average @ 1.2795 , above its 100 Daily moving average @ 1.2634 and above its 200 Daily moving average @ 1.2388
| Trends | Trends.1 | |
|---|---|---|
| 0 | Daily SMA20 | 1.2754 |
| 1 | Daily SMA50 | 1.2795 |
| 2 | Daily SMA100 | 1.2634 |
| 3 | Daily SMA200 | 1.2388 |
The previous day high was 1.28 while the previous day low was 1.2718. The daily 38.2% Fib levels comes at 1.275, expected to provide resistance. Similarly, the daily 61.8% fib level is at 1.2769, expected to provide resistance.
Note the levels of interest below:
- Pivot support is noted at 1.27, 1.2668, 1.2618
- Pivot resistance is noted at 1.2782, 1.2832, 1.2864
| Levels | Levels.1 |
|---|---|
| Previous Daily High | 1.2800 |
| Previous Daily Low | 1.2718 |
| Previous Weekly High | 1.2788 |
| Previous Weekly Low | 1.2617 |
| Previous Monthly High | 1.3142 |
| Previous Monthly Low | 1.2659 |
| Daily Fibonacci 38.2% | 1.2750 |
| Daily Fibonacci 61.8% | 1.2769 |
| Daily Pivot Point S1 | 1.2700 |
| Daily Pivot Point S2 | 1.2668 |
| Daily Pivot Point S3 | 1.2618 |
| Daily Pivot Point R1 | 1.2782 |
| Daily Pivot Point R2 | 1.2832 |
| Daily Pivot Point R3 | 1.2864 |
[/s2If]
Download Nehcap EAWe have two EAs that are operational on our LIVE accounts.
- EA-FIX: Check out the details here. Download EA-FIX . EA-FIX is a non-grid HFT scalper.
- EA-GROWTH: High quality low dd EA using trend grids. Download EA_GROWTHJoin Our Telegram Group
")


