The price of silver, symbolized as XAGUSD, has increased and reached its highest level in two weeks. This marks the fifth day in a row that the silver price has risen. According to the expert’s opinion, there is a belief that the price will continue to rise in the near future.
…
This is a premium post.
[s2If !current_user_can(access_s2member_level4)]Please register for FREE REGISTER to read full post below containing analysis. In case of any error or you think you are not able to read the full post below, please email us at support#nehcap.com [lwa][/s2If] [s2If current_user_can(access_s2member_level1)]
- Silver Price edges higher while refreshing two-week top, up for fifth consecutive day.
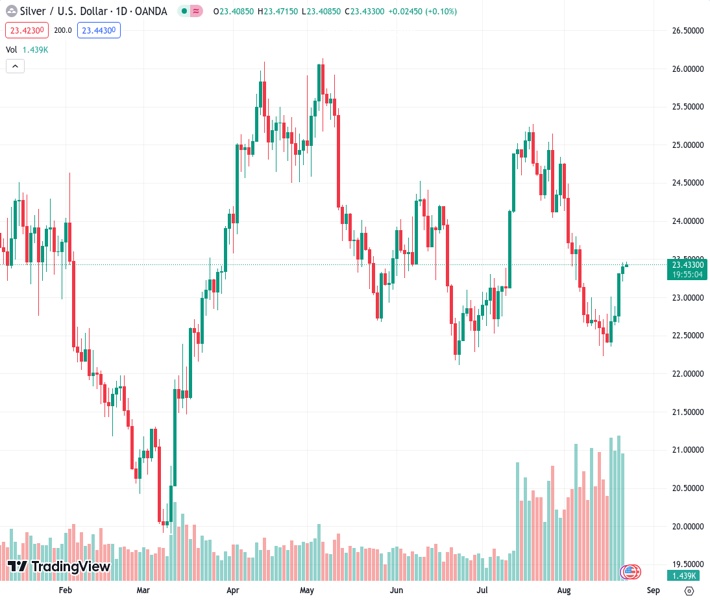
The pair currently trades last at 23.432.
The previous day high was 23.45 while the previous day low was 23.21. The daily 38.2% Fib levels comes at 23.36, expected to provide support. Similarly, the daily 61.8% fib level is at 23.3, expected to provide support.
Silver Price (XAG/USD) picks up bids to refresh two-week high around $23.50 during the mid-Asian session on Wednesday.
In doing so, the XAG/USD prints five-day uptrend while justifying the previous day’s upside break of the 200-DMA, as well as the bullish MACD signals.
Also adding strength to the upside bias is the commodity’s successful recovery from the 61.8% Fibonacci retracement of the XAG/USD’s March–May upside, also known as the “Golden Fibonacci Ratio”. Furthermore, upbeat conditions of the RSI (14) line add strength to the commodity’s recovery moves.
With this, the Silver buyers are likely to overcome the immediate 50-DMA hurdle of $23.50, could direct the buyers toward the late July’s swing low surrounding $24.05.
However, a downward-sloping resistance line from May 05, close to $24.90 by the press time, appears a tough nut to crack for the Silver buyers.
Alternatively, a downside break of the 200-DMA, close to $23.30 at the latest, could convince intraday sellers of the bright metal.
Even so, the 50% and 61.8% Fibonacci retracements, respectively near $23.00 and $22.30, could challenge the Silver bears before giving them control.
Fundamentally, the market’s cautious mood ahead of today’s preliminary readings of the August month Purchasing Managers Indexes (PMIs) and the top-tier central bankers’ speeches at the annual Jackson Hole Symposium event, scheduled for August 24–26, prod the XAG/USD traders.
Also read: Forex Today: USD not ready for a correction, Global PMIs next
Trend: Further upside expected
Technical Levels: Supports and Resistances
XAGUSD currently trading at 23.47 at the time of writing. Pair opened at 23.41 and is trading with a change of 0.26% % .
| Overview | Overview.1 | |
|---|---|---|
| 0 | Today last price | 23.47 |
| 1 | Today Daily Change | 0.06 |
| 2 | Today Daily Change % | 0.26% |
| 3 | Today daily open | 23.41 |
The pair is trading above its 20 Daily moving average @ 23.35, below its 50 Daily moving average @ 23.51 , below its 100 Daily moving average @ 24.0 and above its 200 Daily moving average @ 23.31
| Trends | Trends.1 | |
|---|---|---|
| 0 | Daily SMA20 | 23.35 |
| 1 | Daily SMA50 | 23.51 |
| 2 | Daily SMA100 | 24.00 |
| 3 | Daily SMA200 | 23.31 |
The previous day high was 23.45 while the previous day low was 23.21. The daily 38.2% Fib levels comes at 23.36, expected to provide support. Similarly, the daily 61.8% fib level is at 23.3, expected to provide support.
Note the levels of interest below:
- Pivot support is noted at 23.26, 23.11, 23.02
- Pivot resistance is noted at 23.51, 23.6, 23.75
| Levels | Levels.1 |
|---|---|
| Previous Daily High | 23.45 |
| Previous Daily Low | 23.21 |
| Previous Weekly High | 23.01 |
| Previous Weekly Low | 22.23 |
| Previous Monthly High | 25.27 |
| Previous Monthly Low | 22.52 |
| Daily Fibonacci 38.2% | 23.36 |
| Daily Fibonacci 61.8% | 23.30 |
| Daily Pivot Point S1 | 23.26 |
| Daily Pivot Point S2 | 23.11 |
| Daily Pivot Point S3 | 23.02 |
| Daily Pivot Point R1 | 23.51 |
| Daily Pivot Point R2 | 23.60 |
| Daily Pivot Point R3 | 23.75 |
[/s2If]
Download Nehcap EAWe have two EAs that are operational on our LIVE accounts.
- EA-FIX: Check out the details here. Download EA-FIX . EA-FIX is a non-grid HFT scalper.
- EA-GROWTH: High quality low dd EA using trend grids. Download EA_GROWTHJoin Our Telegram Group
")


