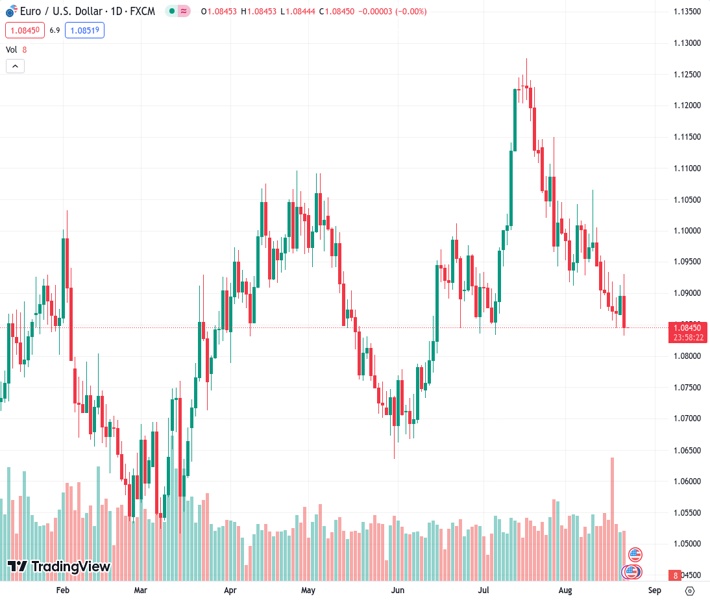
The EURUSD pair, currently trading at 1.08459, experiences a decline of 0.43%, hitting its lowest point for the month at 1.0832. The focus now shifts towards the 200-day Moving Average.
…
This is a premium post.
[s2If !current_user_can(access_s2member_level4)]Please register for FREE REGISTER to read full post below containing analysis. In case of any error or you think you are not able to read the full post below, please email us at support#nehcap.com [lwa][/s2If] [s2If current_user_can(access_s2member_level1)]
- EUR/USD drops 0.43%, reaching a monthly low of 1.0832, with eyes on the 200-day Moving Average.
The pair currently trades last at 1.08459.
The previous day high was 1.0914 while the previous day low was 1.0867. The daily 38.2% Fib levels comes at 1.0896, expected to provide resistance. Similarly, the daily 61.8% fib level is at 1.0885, expected to provide resistance.
EUR/USD lost traction and registered losses of 0.43% on Tuesday, printing a new monthly low of 1.0832 and set to extend its fall toward the 200-day Moving Average (DMA) at 1.0795. However, late EUR/USD buyers stepped into the market and lifted the pair, which trades at 1.0848 after hitting a daily high of 1.0930.
US stocks waver amidst traders’ fragile sentiment as they brace for the US Federal Reserve Chair Jerome Powell’s speech at the Jackson Hole Symposium. US Treasury bond yields underpinned the greenback, with the 3-month, two, and 5-year Treasuries posting gains within the 0.28% – 0.78% range. Consequently, the buck climbs, as depicted by the US Dollar Index (DXY), which measures the buck’s value against a basket of six currencies, gains 0.26%, at 103.591.
Data-wise, the National Association of Realtors (NAR) released data indicating a -2.2% decrease in Existing Home Sales for July. However, it represents an improvement compared to the prior month’s -3.3%. NAR Chief Economist Lawrence Yun attributed this decline to factors such as limited “inventory availability” and elevated “mortgage rates,” according to the report.
The Richmond Fed revealed its Manufacturing Index for August, which plummeted -7 as expected in August, though its Services Index exceeded estimates of a -4 contraction, came at 4.
In recent statements by Richmond Fed President Thomas Barkin, he emphasized that the yield shift does not indicate “inappropriate” market tightening. Instead, he views it as a reaction to robust economic data. Barkin further stated that if inflation maintains its elevated levels and the economy continues showing signs of strength, it would bolster the argument for additional tightening measures.
Across the pond, a light Eurozone (EU) economic docket keeps the EUR/USD pair trading within familiar levels but set to test the next dynamic support at 200-DMA. On Wednesday, the release of S&P Global PMIs could dictate the direction of the EUR/YSD. On the US front, the economic docket would feature Fed speakers, S&P Global PMIs, Durable Good Orders, and New Home Sales.
The EUR/USD is still neutral to downward biased, as price action achieved successive series of lower highs and lower lows, with the August 3 daily low of 1.0912, seen as the first resistance level, crucial for buyers if they want to resume the uptrend. In that outcome, the next resistance would be the 50-DMA at 1.0980 before challenging 1.1000. Nonetheless, the EUR/USD’s path of least resistance is downwards. The first support would be the August 22 low of 1.0832, followed by the 1.0800 mark. A breach of the latter will expose the 200-DMA at 1.0795, and the mid-point between 1.07/1.08.
Technical Levels: Supports and Resistances
EURUSD currently trading at 1.0849 at the time of writing. Pair opened at 1.0896 and is trading with a change of -0.43 % .
| Overview | Overview.1 | |
|---|---|---|
| 0 | Today last price | 1.0849 |
| 1 | Today Daily Change | -0.0047 |
| 2 | Today Daily Change % | -0.4300 |
| 3 | Today daily open | 1.0896 |
The pair is trading below its 20 Daily moving average @ 1.096, below its 50 Daily moving average @ 1.098 , below its 100 Daily moving average @ 1.0931 and above its 200 Daily moving average @ 1.0794
| Trends | Trends.1 | |
|---|---|---|
| 0 | Daily SMA20 | 1.0960 |
| 1 | Daily SMA50 | 1.0980 |
| 2 | Daily SMA100 | 1.0931 |
| 3 | Daily SMA200 | 1.0794 |
The previous day high was 1.0914 while the previous day low was 1.0867. The daily 38.2% Fib levels comes at 1.0896, expected to provide resistance. Similarly, the daily 61.8% fib level is at 1.0885, expected to provide resistance.
Note the levels of interest below:
- Pivot support is noted at 1.087, 1.0845, 1.0824
- Pivot resistance is noted at 1.0917, 1.0939, 1.0964
| Levels | Levels.1 |
|---|---|
| Previous Daily High | 1.0914 |
| Previous Daily Low | 1.0867 |
| Previous Weekly High | 1.0960 |
| Previous Weekly Low | 1.0845 |
| Previous Monthly High | 1.1276 |
| Previous Monthly Low | 1.0834 |
| Daily Fibonacci 38.2% | 1.0896 |
| Daily Fibonacci 61.8% | 1.0885 |
| Daily Pivot Point S1 | 1.0870 |
| Daily Pivot Point S2 | 1.0845 |
| Daily Pivot Point S3 | 1.0824 |
| Daily Pivot Point R1 | 1.0917 |
| Daily Pivot Point R2 | 1.0939 |
| Daily Pivot Point R3 | 1.0964 |
[/s2If]
Download Nehcap EAWe have two EAs that are operational on our LIVE accounts.
- EA-FIX: Check out the details here. Download EA-FIX . EA-FIX is a non-grid HFT scalper.
- EA-GROWTH: High quality low dd EA using trend grids. Download EA_GROWTHJoin Our Telegram Group
")


