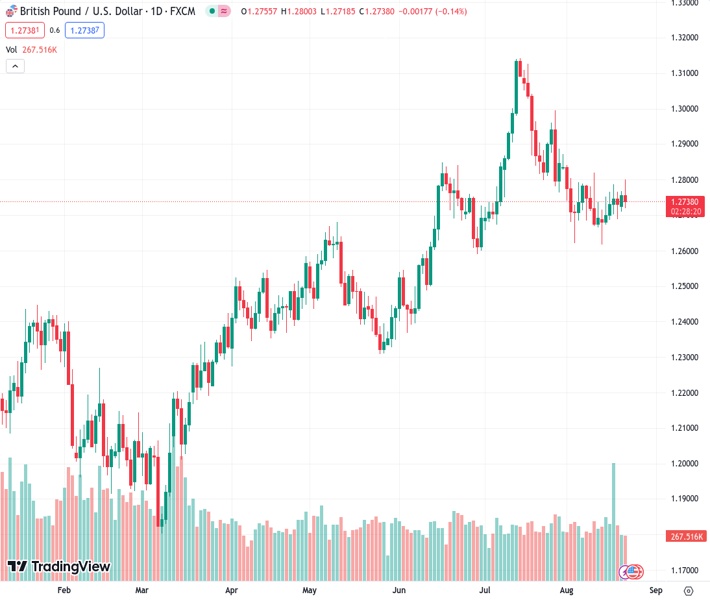
The GBP/USD currency pair at a rate of 1.27381 is experiencing a decrease of 0.12%, which is being caused by the impact of elevated US Treasury bond yields and concerns surrounding international trade.
…
This is a premium post.
[s2If !current_user_can(access_s2member_level4)]Please register for FREE REGISTER to read full post below containing analysis. In case of any error or you think you are not able to read the full post below, please email us at support#nehcap.com [lwa][/s2If] [s2If current_user_can(access_s2member_level1)]
- GBP/USD faces a 0.12% loss, influenced by high US Treasury bond yields and global trade apprehensions.
The pair currently trades last at 1.27381.
The previous day high was 1.2767 while the previous day low was 1.271. The daily 38.2% Fib levels comes at 1.2745, expected to provide resistance. Similarly, the daily 61.8% fib level is at 1.2732, expected to provide support.
GBP/USD retreated after testing the 50-day Moving Average (DMA) but dropped mainly on high US Treasury bond yields and risk aversion spurred by the recent developments surrounding China. Fears that the country with the second largest economy in the world can sharply slow down could weigh on global trade. Hence, the GBP/USD is trading at 1.2741, registering losses of 0.12% at the time of writing.
US stocks are experiencing a decline due to the prevailing fragile market sentiment. The National Association of Realtors (NAR) released data indicating a 2.2% decrease in Existing Home Sales for July. This, however, represents an improvement compared to the preceding month’s figure of -3.3%. NAR Chief Economist Lawrence Yun attributed this decline to factors such as limited “inventory availability” and elevated “mortgage rates,” according to the report.
Other data revealed by the Richmond Fed, the Manufacturing Index plummeted -7 as expected in August, though its Services Index exceeded estimates of a -4 contraction, came at 4.
US bond yields are mixed as the short-end of the curve continues to bull-steepen, while the 10s, 20s, and 30s drop between 0.18 and 0.47 percent. However, the Greenback (USD) continues to rise, with the US Dollar Index (DXY) measuring the buck’s value vs. six currencies, advancing 0.26%, at 103.588.
In recent statements by Richmond Fed President Thomas Barkin, he emphasized that the yield shift does not indicate “inappropriate” market tightening. Instead, he views it as a reaction to robust economic data. Barkin further stated that if inflation maintains its elevated levels and the economy continues showing signs of strength, it would bolster the argument for additional tightening measures.
On the US front, the economic docket would feature Fed speakers, S&P Global PMIs, Durable Good Orders, and New Home Sales.
In the meantime, the UK economic docket would feature the release of S&P Global/CIPS PMIs, which are expected to continue to weaken; in services and manufacturing. The Manufacturing PMI is expected to slide for six consecutive months, while the services PMI is expected to climb to 51.3.
The GBP/USD remains neutrally biased but trading within the 50-day Moving Average (DMA) and the 1.2600 figure for the latest month-to-date (MTD). A bullish resumption would happen once buyers reclaim the 1.2800 mark, exacerbating a rally towards 1.3000, with 1.2900 seen as initial resistance. Conversely, if GBP/USD drops below 1.2600, that could expose the GBP/USD pair to selling pressure. Key support levels to test would be 1.2500, followed by the 200-DMA at 1.2387.
Technical Levels: Supports and Resistances
GBPUSD currently trading at 1.274 at the time of writing. Pair opened at 1.2756 and is trading with a change of -0.13 % .
| Overview | Overview.1 | |
|---|---|---|
| 0 | Today last price | 1.2740 |
| 1 | Today Daily Change | -0.0016 |
| 2 | Today Daily Change % | -0.1300 |
| 3 | Today daily open | 1.2756 |
The pair is trading below its 20 Daily moving average @ 1.2763, below its 50 Daily moving average @ 1.2793 , above its 100 Daily moving average @ 1.2632 and above its 200 Daily moving average @ 1.2384
| Trends | Trends.1 | |
|---|---|---|
| 0 | Daily SMA20 | 1.2763 |
| 1 | Daily SMA50 | 1.2793 |
| 2 | Daily SMA100 | 1.2632 |
| 3 | Daily SMA200 | 1.2384 |
The previous day high was 1.2767 while the previous day low was 1.271. The daily 38.2% Fib levels comes at 1.2745, expected to provide resistance. Similarly, the daily 61.8% fib level is at 1.2732, expected to provide support.
Note the levels of interest below:
- Pivot support is noted at 1.2722, 1.2688, 1.2666
- Pivot resistance is noted at 1.2778, 1.2801, 1.2835
| Levels | Levels.1 |
|---|---|
| Previous Daily High | 1.2767 |
| Previous Daily Low | 1.2710 |
| Previous Weekly High | 1.2788 |
| Previous Weekly Low | 1.2617 |
| Previous Monthly High | 1.3142 |
| Previous Monthly Low | 1.2659 |
| Daily Fibonacci 38.2% | 1.2745 |
| Daily Fibonacci 61.8% | 1.2732 |
| Daily Pivot Point S1 | 1.2722 |
| Daily Pivot Point S2 | 1.2688 |
| Daily Pivot Point S3 | 1.2666 |
| Daily Pivot Point R1 | 1.2778 |
| Daily Pivot Point R2 | 1.2801 |
| Daily Pivot Point R3 | 1.2835 |
[/s2If]
Download Nehcap EAWe have two EAs that are operational on our LIVE accounts.
- EA-FIX: Check out the details here. Download EA-FIX . EA-FIX is a non-grid HFT scalper.
- EA-GROWTH: High quality low dd EA using trend grids. Download EA_GROWTHJoin Our Telegram Group
")


