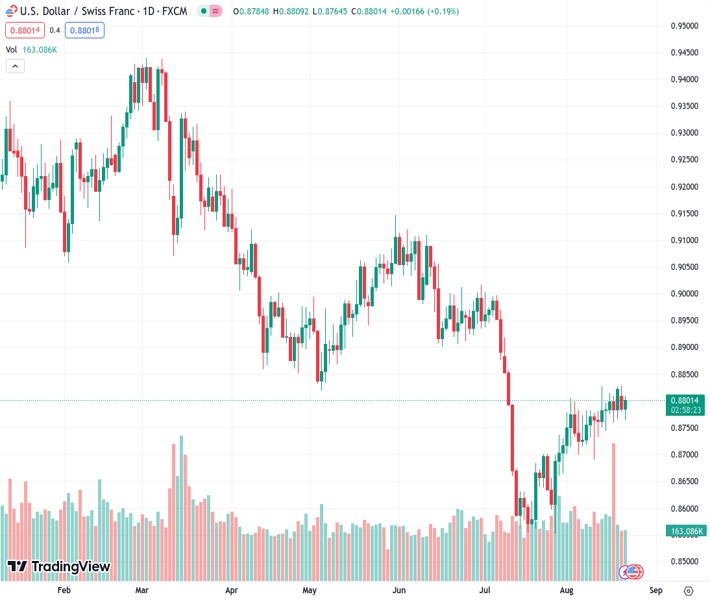
The USDCHF pair is experiencing slight increases around the 0.8800 level.
…
This is a premium post.
[s2If !current_user_can(access_s2member_level4)]Please register for FREE REGISTER to read full post below containing analysis. In case of any error or you think you are not able to read the full post below, please email us at support#nehcap.com [lwa][/s2If] [s2If current_user_can(access_s2member_level1)]
- USD/CHF shows mild gains near the 0.8800 area.
The pair currently trades last at 0.88001.
The previous day high was 0.8828 while the previous day low was 0.878. The daily 38.2% Fib levels comes at 0.8798, expected to provide support. Similarly, the daily 61.8% fib level is at 0.881, expected to provide resistance.
On Tuesday, the USD/CHF traded with mild gains, near the critical 0.8800 zone. On the US side, Thomas Barking from the Federal Reserve (Fed) commented that more tightening may be needed while investors await Wednesday’s PMIs from August and Jerome Powell’s Friday speech. On the CHF side, Switzerland reported a higher than expected Trade Balance deficit in July, which seems to be pressuring the CHF. Besides that, no relevant data will be released on the Swiss front for the rest of the week.
That said, the USD measured by the DXY index upside potential is limited in a risk-positive market environment, with major US stock indexes closing green on Monday’s session. On a positive note, Thomas Barkin from the Fed delivered hawkish comments and stated , “If inflation remains high and demand gives no signal that it is likely to drop, that would require a tighter monetary policy”. As a reaction, US Treasury yields recovered some ground, and hawkish bets may limit further losses for the USD.
Attention is now set to the Jackson Hole Symposium, which will kick off on Thursday, and S&P Global Manufacturing figures from the US from July on Wednesday. Those figures are expected to show a decelerating economic activity but remain in expansion territory and will help investors model their expectations towards the next Federal Reserve (Fed) meeting. As for now, markets are still confident that the Fed will pause in September and then bet on higher odds of a hike in November of 25 basis points (bps)
Analysing the daily chart, it is apparent that the USD/CHF has a neutral to bullish technical stance, with the bulls gradually recovering ground but still not in command. The Relative Strength Index (RSI) indicates positive momentum with an ascending slope above its midline, while the Moving Average Convergence (MACD) lays out flat green bars.On the other hand, the pair is above the 20-day Simple Moving Average (SMA) but below the 100 and 200-day Simple Moving Average (SMAs), suggesting that despite the recent bearish sentiment, the bulls are still resilient, holding some momentum.
Support levels: 0.8750 (20-day SMA), 0.8730, 0.8715.
Resistance levels: 0.8800, 0.8820, 0.8850.
Technical Levels: Supports and Resistances
USDCHF currently trading at 0.8796 at the time of writing. Pair opened at 0.8785 and is trading with a change of 0.13 % .
| Overview | Overview.1 | |
|---|---|---|
| 0 | Today last price | 0.8796 |
| 1 | Today Daily Change | 0.0011 |
| 2 | Today Daily Change % | 0.1300 |
| 3 | Today daily open | 0.8785 |
The pair is trading above its 20 Daily moving average @ 0.8745, below its 50 Daily moving average @ 0.881 , below its 100 Daily moving average @ 0.8899 and below its 200 Daily moving average @ 0.9097
| Trends | Trends.1 | |
|---|---|---|
| 0 | Daily SMA20 | 0.8745 |
| 1 | Daily SMA50 | 0.8810 |
| 2 | Daily SMA100 | 0.8899 |
| 3 | Daily SMA200 | 0.9097 |
The previous day high was 0.8828 while the previous day low was 0.878. The daily 38.2% Fib levels comes at 0.8798, expected to provide support. Similarly, the daily 61.8% fib level is at 0.881, expected to provide resistance.
Note the levels of interest below:
- Pivot support is noted at 0.8767, 0.875, 0.8719
- Pivot resistance is noted at 0.8815, 0.8846, 0.8863
| Levels | Levels.1 |
|---|---|
| Previous Daily High | 0.8828 |
| Previous Daily Low | 0.8780 |
| Previous Weekly High | 0.8828 |
| Previous Weekly Low | 0.8738 |
| Previous Monthly High | 0.9005 |
| Previous Monthly Low | 0.8552 |
| Daily Fibonacci 38.2% | 0.8798 |
| Daily Fibonacci 61.8% | 0.8810 |
| Daily Pivot Point S1 | 0.8767 |
| Daily Pivot Point S2 | 0.8750 |
| Daily Pivot Point S3 | 0.8719 |
| Daily Pivot Point R1 | 0.8815 |
| Daily Pivot Point R2 | 0.8846 |
| Daily Pivot Point R3 | 0.8863 |
[/s2If]
Download Nehcap EAWe have two EAs that are operational on our LIVE accounts.
- EA-FIX: Check out the details here. Download EA-FIX . EA-FIX is a non-grid HFT scalper.
- EA-GROWTH: High quality low dd EA using trend grids. Download EA_GROWTHJoin Our Telegram Group
")


