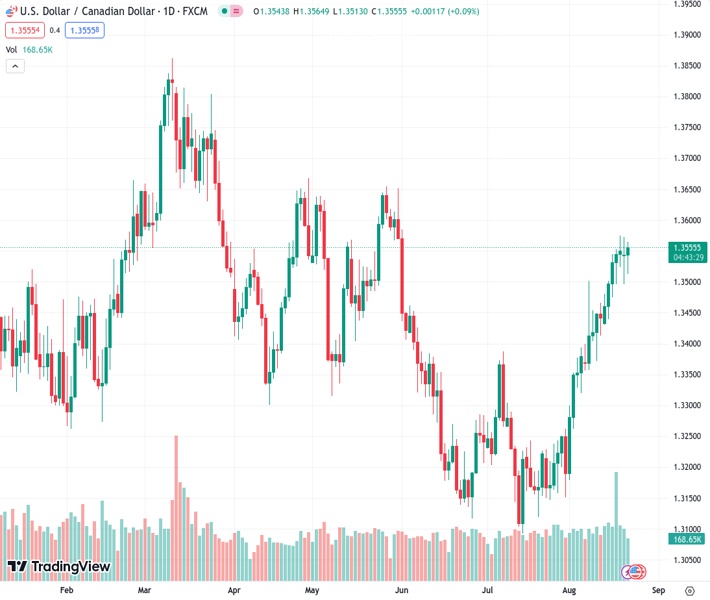
The USDCAD exchange rate, currently at 1.35536, has experienced six days of gains out of the past seven days. It has now reached a value of 1.3550, which is the highest it has been since the beginning of June.
…
This is a premium post.
[s2If !current_user_can(access_s2member_level4)]Please register for FREE REGISTER to read full post below containing analysis. In case of any error or you think you are not able to read the full post below, please email us at support#nehcap.com [lwa][/s2If] [s2If current_user_can(access_s2member_level1)]
- USD/CAD sets a six out of the last seven days of gains and rose to 1.3550, trading its highest since early June
The pair currently trades last at 1.35536.
The previous day high was 1.3573 while the previous day low was 1.3496. The daily 38.2% Fib levels comes at 1.3525, expected to provide support. Similarly, the daily 61.8% fib level is at 1.3543, expected to provide support.
In Tuesday’s session, the USD/CAD continued to gain ground, mainly driven by the broad-based CAD weakness. On the other hand, investors await key manufacturing and services sector PMIs from August to be released. Eyes are also set on Powell’s speech on Friday at the annual Jackson Hole Symposium.
The USD is trading somewhat weak against most of its rivals, primarily due to investors showing more interest in risk-sensitive assets. On the data front, Existing Home Sales from the US came in slightly lower than expected at 4.07M in July vs the 4.15M expected and the previous 4.16M but failed to impact the Greenback significantly.
For the rest of the week, the focus shift to the Jackson Hole Symposium, which will kick off on Thursday, and on Wednesday, the American economic calendar will feature S&P Global PMI data which is expected to show a deceleration in the US service and manufacturing sector.
On the CAD front, no relevant data will be released during the session, and the weakness of Oil prices is contributing to the Canadian currency decline. In that sense, due to Chinese economic concerns, the black gold prices continue to retreat and fell to their lowest point since early August.
Evaluating technical indicators, the USD/CAD displays a short-term bullish outlook. Nevertheless, traders should take caution due to the emergence of overbought signals, which may lead to a technical correction in the near term. The Relative Strength Index (RSI) is in overbought territory above 70.00, while the Moving Average Convergence (MACD) histogram exhibits more oversized green bars. In addition, the pair is above the 20,100,200-day Simple Moving Averages (SMAs), indicating a favourable position for the bulls in the bigger picture.
Support levels: 1.3530, 1.3500, 1.3490.
Resistance levels: 1.3570, 1.3590, 1.3600.
Technical Levels: Supports and Resistances
USDCAD currently trading at 1.355 at the time of writing. Pair opened at 1.3545 and is trading with a change of 0.04 % .
| Overview | Overview.1 | |
|---|---|---|
| 0 | Today last price | 1.3550 |
| 1 | Today Daily Change | 0.0005 |
| 2 | Today Daily Change % | 0.0400 |
| 3 | Today daily open | 1.3545 |
The pair remains strongly bullish on the daily timeframe. It trades above its 20 SMA @ 1.3382, 50 SMA 1.3285, 100 SMA @ 1.3386 and 200 SMA @ 1.3454.
| Trends | Trends.1 | |
|---|---|---|
| 0 | Daily SMA20 | 1.3382 |
| 1 | Daily SMA50 | 1.3285 |
| 2 | Daily SMA100 | 1.3386 |
| 3 | Daily SMA200 | 1.3454 |
The previous day high was 1.3573 while the previous day low was 1.3496. The daily 38.2% Fib levels comes at 1.3525, expected to provide support. Similarly, the daily 61.8% fib level is at 1.3543, expected to provide support.
Note the levels of interest below:
- Pivot support is noted at 1.3503, 1.3461, 1.3426
- Pivot resistance is noted at 1.358, 1.3614, 1.3656
| Levels | Levels.1 |
|---|---|
| Previous Daily High | 1.3573 |
| Previous Daily Low | 1.3496 |
| Previous Weekly High | 1.3575 |
| Previous Weekly Low | 1.3437 |
| Previous Monthly High | 1.3387 |
| Previous Monthly Low | 1.3093 |
| Daily Fibonacci 38.2% | 1.3525 |
| Daily Fibonacci 61.8% | 1.3543 |
| Daily Pivot Point S1 | 1.3503 |
| Daily Pivot Point S2 | 1.3461 |
| Daily Pivot Point S3 | 1.3426 |
| Daily Pivot Point R1 | 1.3580 |
| Daily Pivot Point R2 | 1.3614 |
| Daily Pivot Point R3 | 1.3656 |
[/s2If]
Download Nehcap EAWe have two EAs that are operational on our LIVE accounts.
- EA-FIX: Check out the details here. Download EA-FIX . EA-FIX is a non-grid HFT scalper.
- EA-GROWTH: High quality low dd EA using trend grids. Download EA_GROWTHJoin Our Telegram Group
")


