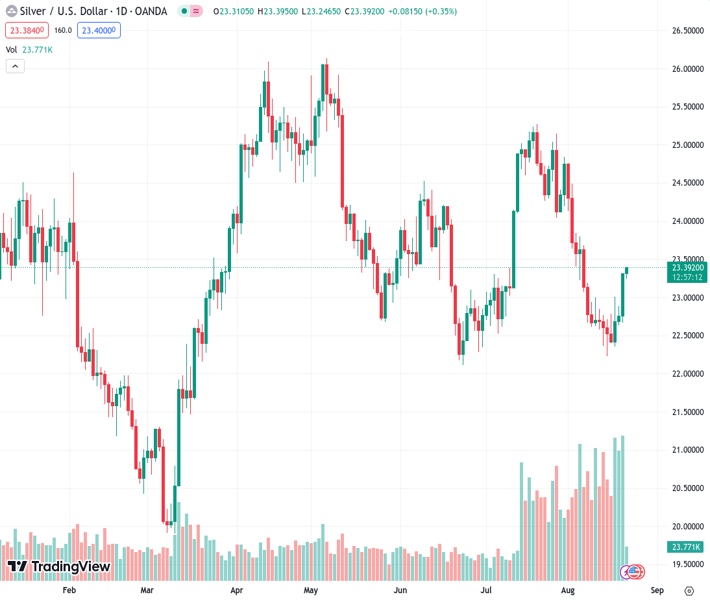
Silver price at $23.369 takes a break from its upward movement of the past three days, encountering resistance near the 38.2% Fibonacci level.
…
This is a premium post.
[s2If !current_user_can(access_s2member_level4)]Please register for FREE REGISTER to read full post below containing analysis. In case of any error or you think you are not able to read the full post below, please email us at support#nehcap.com [lwa][/s2If] [s2If current_user_can(access_s2member_level1)]
- Silver pauses a three-day-old ascending trend near the 38.2% Fibo. resistance.
The pair currently trades last at 23.369.
The previous day high was 23.32 while the previous day low was 22.67. The daily 38.2% Fib levels comes at 23.07, expected to provide support. Similarly, the daily 61.8% fib level is at 22.92, expected to provide support.
Silver enters a bullish consolidation phase and oscillates in a narrow range around the $23.30 region, just below its highest level in more than two weeks touched earlier this Tuesday.
From a technical perspective, the XAG/USD, for now, seems to have paused its recent recovery from the $22.20 area, or a nearly two-month low, near a resistance marked by the 38.2% Fibonacci retracement level of the July-August downfall. A sustained strength beyond the said barrier will be seen as a fresh trigger for bullish traders and pave the way for a further near-term appreciating move.
Given that oscillators on the daily chart have just started moving in the positive territory, the XAG/USD could then climb to 50% Fibo. resistance near the $23.75 region. The momentum could get extended to the $24.00-$24.10 confluence, comprising the 100-day SMA and the 61.8% Fibo. level. Some follow-through buying will suggest that a nearly one-month-old downfall has run its course.
On the flip side, any meaningful pullback now seems to find decent support near the $23.00 round figure, which now coincides with the 23.6% Fibo. level. This is followed by the $22.70-$22.65 support zone, which if broken decisively will expose the multi-month low, around the $22.10 region touched in June. This is followed by the $22.00 mark, below which Sliver could slide to the $21.55-$21.50 area.
The downward trajectory could get extended further towards the $21.00 round figure en route to the $20.60 area, below which the XAG/USD could drop to challenge the $20.00 psychological mark.
Technical Levels: Supports and Resistances
XAGUSD currently trading at 23.35 at the time of writing. Pair opened at 23.31 and is trading with a change of 0.17 % .
| Overview | Overview.1 | |
|---|---|---|
| 0 | Today last price | 23.35 |
| 1 | Today Daily Change | 0.04 |
| 2 | Today Daily Change % | 0.17 |
| 3 | Today daily open | 23.31 |
The pair is trading below its 20 Daily moving average @ 23.42, below its 50 Daily moving average @ 23.52 , below its 100 Daily moving average @ 24.01 and above its 200 Daily moving average @ 23.3
| Trends | Trends.1 | |
|---|---|---|
| 0 | Daily SMA20 | 23.42 |
| 1 | Daily SMA50 | 23.52 |
| 2 | Daily SMA100 | 24.01 |
| 3 | Daily SMA200 | 23.30 |
The previous day high was 23.32 while the previous day low was 22.67. The daily 38.2% Fib levels comes at 23.07, expected to provide support. Similarly, the daily 61.8% fib level is at 22.92, expected to provide support.
Note the levels of interest below:
- Pivot support is noted at 22.88, 22.45, 22.23
- Pivot resistance is noted at 23.53, 23.75, 24.18
| Levels | Levels.1 |
|---|---|
| Previous Daily High | 23.32 |
| Previous Daily Low | 22.67 |
| Previous Weekly High | 23.01 |
| Previous Weekly Low | 22.23 |
| Previous Monthly High | 25.27 |
| Previous Monthly Low | 22.52 |
| Daily Fibonacci 38.2% | 23.07 |
| Daily Fibonacci 61.8% | 22.92 |
| Daily Pivot Point S1 | 22.88 |
| Daily Pivot Point S2 | 22.45 |
| Daily Pivot Point S3 | 22.23 |
| Daily Pivot Point R1 | 23.53 |
| Daily Pivot Point R2 | 23.75 |
| Daily Pivot Point R3 | 24.18 |
[/s2If]
Download Nehcap EAWe have two EAs that are operational on our LIVE accounts.
- EA-FIX: Check out the details here. Download EA-FIX . EA-FIX is a non-grid HFT scalper.
- EA-GROWTH: High quality low dd EA using trend grids. Download EA_GROWTHJoin Our Telegram Group
")


