The USD to IDR exchange rate remains at around 15,325, showing a positive trend due to the increase in US Treasury bond yields and the strengthening of the USD.
…
This is a premium post.
[s2If !current_user_can(access_s2member_level4)]Please register for FREE REGISTER to read full post below containing analysis. In case of any error or you think you are not able to read the full post below, please email us at support#nehcap.com [lwa][/s2If] [s2If current_user_can(access_s2member_level1)]
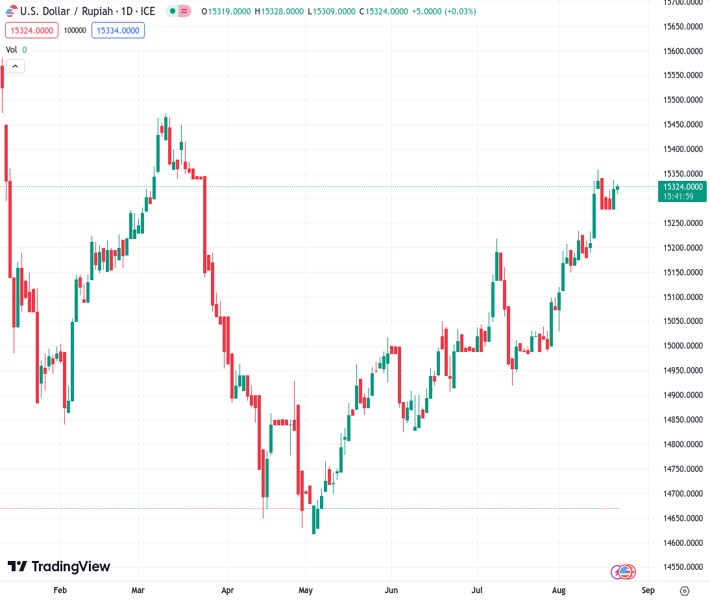
- USD/IDR holds positive ground near 15,325 amid higher US Treasury bond yields and the stronger USD.
The pair currently trades last at 15325.0.
The previous day high was 15339.0 while the previous day low was 15285.0. The daily 38.2% Fib levels comes at 15318.372, expected to provide support. Similarly, the daily 61.8% fib level is at 15305.628, expected to provide support.
USD/IDR extends its upside near 15,325 heading into the early European session on Tuesday. The prevailing US dollar buying is bolstered by the anticipation that Federal Reserve (Fed) will prolong the tightening cycle. Market players await the Bank Indonesia (BI) interest rate decision on Thursday and Federal Reserve (Fed) Chair Jerome Powell’s speech at the Jackson Hole Symposium on Friday for fresh impetus.
That said, the Indonesian central bank is expected to maintain its benchmark interest rate at 5.75% for the seventh consecutive meeting on Thursday and for the entire year, According to a Reuters poll conducted between August 14 and 21.
Furthermore, the weakening of the Rupiah is driven by the higher US Treasury bond yields and the stronger USD. The 10-year Treasury bond yield stands at 4.344% after climbing to 3.366% the highest level of 2007. Meanwhile, Indonesian 10-year bond yields rise to 6.725%, their highest level since April.
Apart from this, a smaller margin than anticipated rate cut by the People’s Bank of China (PBoC) on Monday exerts pressure on the Rupiah. The Chinese central bank slashed its Loan Prime Rate (LPR) for one year by 10 basis points (bps) to 3.45% from 3.55% and maintained the five-year LPR unchanged at 4.2%. The uncertainty in the Chinese economy will be a burden on Indonesia’s growth. Nevertheless, Chinese authorities reported on Sunday that the nation would arrange financial support to resolve local government debt worries, according to Reuters. This, in turn, might cap the downside of the Rupiah and acts as a headwind for USD/IDR.
On the US Dollar front, investors raise their bets on additional rate hikes by the Federal Reserve (Fed) despite the robust labor data and weaker inflation data last week. Fed Chairman Jerome Powell Speaks on Friday will be a guide for investors and could provide insights into economic conditions. A hawkish tone might boost the Greenback against its rivals.
Looking ahead, market players will closely watch the BI monetary policy decision on Thursday. Fed Chair Jerome Powell’s speech at the Jackson Hole Symposium on Friday will be in the spotlight this week. Traders will take cues from the data and find opportunities around USD/IDR.
Technical Levels: Supports and Resistances
USDIDR currently trading at 15327.0 at the time of writing. Pair opened at 15325.0 and is trading with a change of 0.01 % .
| Overview | Overview.1 | |
|---|---|---|
| 0 | Today last price | 15327.00 |
| 1 | Today Daily Change | 2.00 |
| 2 | Today Daily Change % | 0.01 |
| 3 | Today daily open | 15325.00 |
The pair remains strongly bullish on the daily timeframe. It trades above its 20 SMA @ 15208.5075, 50 SMA 15093.563, 100 SMA @ 14976.421 and 200 SMA @ 15167.716.
| Trends | Trends.1 | |
|---|---|---|
| 0 | Daily SMA20 | 15208.5075 |
| 1 | Daily SMA50 | 15093.5630 |
| 2 | Daily SMA100 | 14976.4210 |
| 3 | Daily SMA200 | 15167.7160 |
The previous day high was 15339.0 while the previous day low was 15285.0. The daily 38.2% Fib levels comes at 15318.372, expected to provide support. Similarly, the daily 61.8% fib level is at 15305.628, expected to provide support.
Note the levels of interest below:
- Pivot support is noted at 15293.6667, 15262.3333, 15239.6667
- Pivot resistance is noted at 15347.6667, 15370.3333, 15401.6667
| Levels | Levels.1 |
|---|---|
| Previous Daily High | 15339.0000 |
| Previous Daily Low | 15285.0000 |
| Previous Weekly High | 15397.2500 |
| Previous Weekly Low | 15225.0050 |
| Previous Monthly High | 15916.7000 |
| Previous Monthly Low | 13588.0000 |
| Daily Fibonacci 38.2% | 15318.3720 |
| Daily Fibonacci 61.8% | 15305.6280 |
| Daily Pivot Point S1 | 15293.6667 |
| Daily Pivot Point S2 | 15262.3333 |
| Daily Pivot Point S3 | 15239.6667 |
| Daily Pivot Point R1 | 15347.6667 |
| Daily Pivot Point R2 | 15370.3333 |
| Daily Pivot Point R3 | 15401.6667 |
[/s2If]
Download Nehcap EAWe have two EAs that are operational on our LIVE accounts.
- EA-FIX: Check out the details here. Download EA-FIX . EA-FIX is a non-grid HFT scalper.
- EA-GROWTH: High quality low dd EA using trend grids. Download EA_GROWTHJoin Our Telegram Group
")


