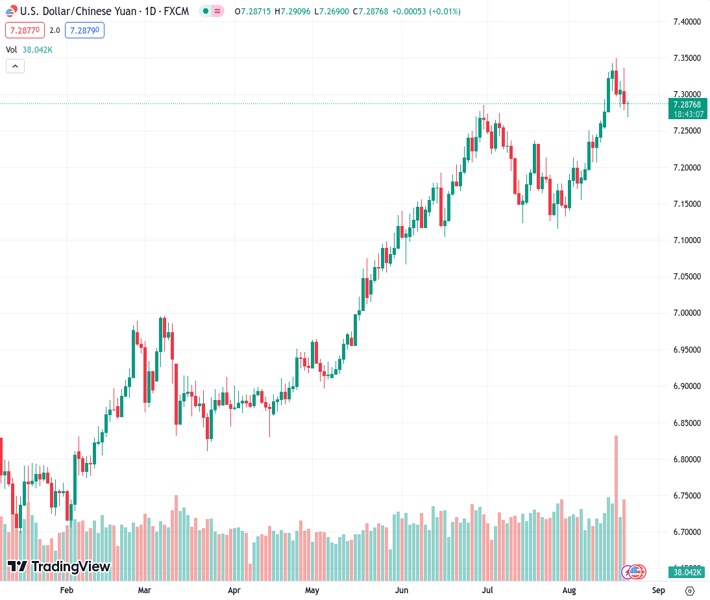
The USD/CNH currency pair rebounds from its lowest point of the day but still maintains a bearish trend that started at the beginning of the week.
…
This is a premium post.
[s2If !current_user_can(access_s2member_level4)]Please register for FREE REGISTER to read full post below containing analysis. In case of any error or you think you are not able to read the full post below, please email us at support#nehcap.com [lwa][/s2If] [s2If current_user_can(access_s2member_level1)]
- USD/CNH bounces off intraday low but defends week-start bearish move.
The pair currently trades last at 7.28803.
The previous day high was 7.3362 while the previous day low was 7.2782. The daily 38.2% Fib levels comes at 7.3003, expected to provide resistance. Similarly, the daily 61.8% fib level is at 7.3141, expected to provide resistance.
USD/CNH rebounds from a one-week low, marked earlier in the day, as it picks up bids to 7.2880 as markets in China open for Tuesday. In doing so, the offshore Chinese Yuan (CNH) justifies the People’s Bank of China’s (PBoC) efforts to defend the currency, as well as a growing gap between the US and Chinese Treasury bond yields.
PBoC’s successive Open Market Operations (OMO) and the previous day’s rate cuts prod the Yuan buyers, especially amid the sour sentiment. On Tuesday, the PBoC’s daily OMO suggest a net drain of around 93 billion Yuan on the day.
That said, Bloomberg came out with an analytical piece suggesting the market’s lack of confidence in the PBoC’s ability to defend the Yuan. Also weighing on the Chinese currency are the fears of witnessing strong wage growth from the US.
Late Monday, the Federal Reserve Bank of New York unveiled its SCE Labor Market Survey results late Monday that suggested record wage expectations and could have contributed to the latest risk-off mood, as well as firmer bond yields. “The Lowest wage respondents would be willing to accept for a new job jumped to a record high of $78,645 in July, up from $72.873 a year ago,” said the findings.
Elsewhere, the difference between the 10-year US and Chinese Treasury bond yields jump to the widest since 2007.
Furthermore, sour sentiment also puts a floor under the USD/CNH Price. That said, S&P500 Futures register the first daily loss in three while fading the previous two-day rebound from a nine-week low, down 0.15% intraday to 4,405 by the press time, as the S&P Global Ratings downgrades several US banks while highlighting the negative impacts of the higher rates and a decline in deposits. It’s worth noting that Moody’s initiated such moves early in August and triggered the risk-off mood.
Additionally, rumors about Chinese warship damage in Taiwan Strait also challenge the USD/CNH bears.
Moving on, China news and yields may entertain the USD/CNH traders while the US Existing Home Sales for July and Richmond Fed Manufacturing Index for August will join speeches from the mid-tier Federal Reserve (Fed) officials to entertain the intraday traders.
USD/CNH bears need a daily closing beneath a one-month-old rising support line, close to 7.2815 by the press time, to retake control.
Technical Levels: Supports and Resistances
USDCNH currently trading at 7.2878 at the time of writing. Pair opened at 7.2884 and is trading with a change of -0.01% % .
| Overview | Overview.1 | |
|---|---|---|
| 0 | Today last price | 7.2878 |
| 1 | Today Daily Change | -0.0006 |
| 2 | Today Daily Change % | -0.01% |
| 3 | Today daily open | 7.2884 |
The pair remains strongly bullish on the daily timeframe. It trades above its 20 SMA @ 7.2264, 50 SMA 7.2121, 100 SMA @ 7.0971 and 200 SMA @ 7.0048.
| Trends | Trends.1 | |
|---|---|---|
| 0 | Daily SMA20 | 7.2264 |
| 1 | Daily SMA50 | 7.2121 |
| 2 | Daily SMA100 | 7.0971 |
| 3 | Daily SMA200 | 7.0048 |
The previous day high was 7.3362 while the previous day low was 7.2782. The daily 38.2% Fib levels comes at 7.3003, expected to provide resistance. Similarly, the daily 61.8% fib level is at 7.3141, expected to provide resistance.
Note the levels of interest below:
- Pivot support is noted at 7.2657, 7.2428, 7.2076
- Pivot resistance is noted at 7.3238, 7.359, 7.3818
| Levels | Levels.1 |
|---|---|
| Previous Daily High | 7.3362 |
| Previous Daily Low | 7.2782 |
| Previous Weekly High | 7.3496 |
| Previous Weekly Low | 7.2580 |
| Previous Monthly High | 7.2744 |
| Previous Monthly Low | 7.1160 |
| Daily Fibonacci 38.2% | 7.3003 |
| Daily Fibonacci 61.8% | 7.3141 |
| Daily Pivot Point S1 | 7.2657 |
| Daily Pivot Point S2 | 7.2428 |
| Daily Pivot Point S3 | 7.2076 |
| Daily Pivot Point R1 | 7.3238 |
| Daily Pivot Point R2 | 7.3590 |
| Daily Pivot Point R3 | 7.3818 |
[/s2If]
Download Nehcap EAWe have two EAs that are operational on our LIVE accounts.
- EA-FIX: Check out the details here. Download EA-FIX . EA-FIX is a non-grid HFT scalper.
- EA-GROWTH: High quality low dd EA using trend grids. Download EA_GROWTHJoin Our Telegram Group
")


