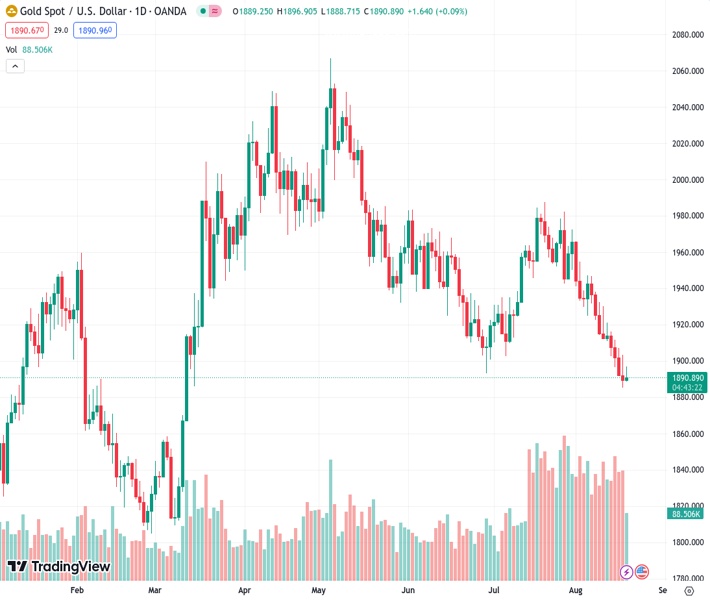
The price of XAUUSD, currently at 1,890.72, has made a recovery towards $1,890 but is still expected to experience a decline for the week.
…
This is a premium post.
[s2If !current_user_can(access_s2member_level4)]Please register for FREE REGISTER to read full post below containing analysis. In case of any error or you think you are not able to read the full post below, please email us at support#nehcap.com [lwa][/s2If] [s2If current_user_can(access_s2member_level1)]
- XAU/USD recovered towards $1,890, still poised for a weekly decline.
The pair currently trades last at 1890.72.
The previous day high was 1903.61 while the previous day low was 1885.13. The daily 38.2% Fib levels comes at 1892.19, expected to provide resistance. Similarly, the daily 61.8% fib level is at 1896.55, expected to provide resistance.
At the end of the week, the XAU/USD Gold spot slightly recovered to $1,890, but it is still poised for a 1% weekly decline, its fourth weekly loss in a row. The metal seems to be consolidating losses after seeing red in the previous four days and also got a boost due to risk aversion fueled by markets worrying about the Chinese economy’s health.
In that sense, a sour market mood was spread due to a Chinese real estate giant, Evergrande, filing for bankruptcy protection in a US court. It’s worth noticing that the same giant had defaulted on huge debts back in 2021, which sent shockwaves through financial markets so the yellow metal may benefit in the upcoming sessions as investors may take refuge in it.
On the other hand, what explains the XAU/USD’s decline is that US Treasury yields, often seen as the opportunity cost of holding gold, sharply rose, mainly because of the hawkish stance seen by the Federal Open Market Committee (FOMC) in Wednesday’s minutes from the July meeting which saw participants leaving the door open for another hike. To end the week, US rates are declining, as investors may be taking refuge in bonds allowing the metal to gain traction.
The technical analysis of the daily chart suggests a neutral to bearish stance for XAU/USD as the bulls are working on staging a recovery but are still deep in negative territory. With an ascending slope below its midline, the Relative Strength Index (RSI) suggests a potential increase in buying pressure, while the Moving Average Convergence (MACD) displays neutral red bars. Furthermore, the pair is below the 20,100 and 200-day Simple Moving Averages (SMAs), implying that the bears retain control on a broader scale while the buyers are urged to make improvements.
Support levels: $1,870, $1,850, $1,830
Resistance levels: $1,900, $1,906 (200-day SMA), $1,930.
Technical Levels: Supports and Resistances
XAUUSD currently trading at 1891.35 at the time of writing. Pair opened at 1889.36 and is trading with a change of 0.11 % .
| Overview | Overview.1 | |
|---|---|---|
| 0 | Today last price | 1891.35 |
| 1 | Today Daily Change | 1.99 |
| 2 | Today Daily Change % | 0.11 |
| 3 | Today daily open | 1889.36 |
The pair remains strongly bearish on the daily time frame. It trades below the 20 SMA @ 1933.62, 50 SMA 1936.57, 100 SMA @ 1963.57 and 200 SMA @ 1906.05.
| Trends | Trends.1 | |
|---|---|---|
| 0 | Daily SMA20 | 1933.62 |
| 1 | Daily SMA50 | 1936.57 |
| 2 | Daily SMA100 | 1963.57 |
| 3 | Daily SMA200 | 1906.05 |
The previous day high was 1903.61 while the previous day low was 1885.13. The daily 38.2% Fib levels comes at 1892.19, expected to provide resistance. Similarly, the daily 61.8% fib level is at 1896.55, expected to provide resistance.
Note the levels of interest below:
- Pivot support is noted at 1881.79, 1874.22, 1863.31
- Pivot resistance is noted at 1900.27, 1911.18, 1918.75
| Levels | Levels.1 |
|---|---|
| Previous Daily High | 1903.61 |
| Previous Daily Low | 1885.13 |
| Previous Weekly High | 1946.82 |
| Previous Weekly Low | 1910.92 |
| Previous Monthly High | 1987.54 |
| Previous Monthly Low | 1902.77 |
| Daily Fibonacci 38.2% | 1892.19 |
| Daily Fibonacci 61.8% | 1896.55 |
| Daily Pivot Point S1 | 1881.79 |
| Daily Pivot Point S2 | 1874.22 |
| Daily Pivot Point S3 | 1863.31 |
| Daily Pivot Point R1 | 1900.27 |
| Daily Pivot Point R2 | 1911.18 |
| Daily Pivot Point R3 | 1918.75 |
[/s2If]
Download Nehcap EAWe have two EAs that are operational on our LIVE accounts.
- EA-FIX: Check out the details here. Download EA-FIX . EA-FIX is a non-grid HFT scalper.
- EA-GROWTH: High quality low dd EA using trend grids. Download EA_GROWTHJoin Our Telegram Group
")


