The global market is exercising caution as a result of China’s economic decline, as seen in the latest data on retail sales, exports, and the turmoil in the property market. #USDMXN is currently at 17.1287.
…
This is a premium post.
[s2If !current_user_can(access_s2member_level4)]Please register for FREE REGISTER to read full post below containing analysis. In case of any error or you think you are not able to read the full post below, please email us at support#nehcap.com [lwa][/s2If] [s2If current_user_can(access_s2member_level1)]
- Global market sentiment remains cautious due to China’s economic slowdown, evident from recent data on retail sales, exports, and property market turmoil.
The pair currently trades last at 17.1287.
The previous day high was 17.1684 while the previous day low was 17.0329. The daily 38.2% Fib levels comes at 17.0847, expected to provide support. Similarly, the daily 61.8% fib level is at 17.1167, expected to provide support.
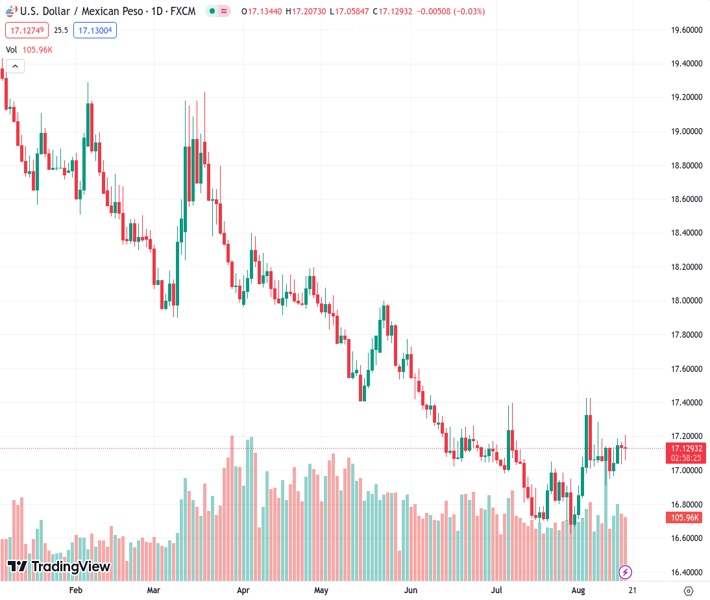
The Mexican Peso (MXN) appreciates against the US Dollar (USD) after hitting a weekly low of 17.2073. However, the USD/MXN retraced below the 17.1000 figure despite US bond yields advance and global economic woes and expectations of additional tightening. The USD/MXN is trading at 17.0884, down 0.27%.
Market sentiment is still depressed amid China’s ongoing economic slowdown, as shown by data. Retail sales slowing, exports falling, and turmoil in its property market keeps investors nervous. The Fed’s latest meeting minutes were revealed, tilted hawkish amid growing division amongst its board members.
The most recent Federal Reserve minutes indicated that board members uniformly approved a rate increase. However, a growing trend of more neutral voices expressing concerns about the potential of pushing rates excessively. This sentiment persists even though most policymakers perceive inflation risks as leaning toward the upside. Nevertheless, the officials are adopting a prudent stance when shaping monetary policy. This is evident as they emphasized their commitment to assessing the “totality” of data before making any decisions.
Still, chances for additional tightening in November increased compared to a week ago, as shown by the CME FedWatch Tool, with odds at 34.6%, above last week’s 27.8%.
Data-wise, the US Department of Labor (DoL) revealed the last week’s Initial Jobless Claims, which came at 239K below estimates of 240K. At the same, the Philadelphia Fed Manufacturing Index for August improved, with numbers hitting 12, exceeding the -10 contraction expected by analysts.
The lack of economic data on the Mexican front keeps USD/MXN traders adrift to US Dollar (USD) dynamics and market sentiment. However, it appears the pair had found a bottom at around the 16.6000/17.0000 range, awaiting a fresh catalyst.
The USD/MXN daily chart portrays the pair oscillating around 17.0000, with the 20-day Moving Average (DMA) acting as support at 17.0337, while the 50-day Moving Average (DMA) stands as resistance at 17.1222. A breach of the latter, and the USD/MXN would rally towards the 100-DMA at 17.4466m ahead of the psychological 17.5000 figure. Conversely, a daily close below 17.0000 would expose the YTD low of 16.6238.
Technical Levels: Supports and Resistances
USDMXN currently trading at 17.0966 at the time of writing. Pair opened at 17.1348 and is trading with a change of -0.22 % .
| Overview | Overview.1 | |
|---|---|---|
| 0 | Today last price | 17.0966 |
| 1 | Today Daily Change | -0.0382 |
| 2 | Today Daily Change % | -0.2200 |
| 3 | Today daily open | 17.1348 |
The pair is trading above its 20 Daily moving average @ 16.9912, above its 50 Daily moving average @ 17.0384 , below its 100 Daily moving average @ 17.45 and below its 200 Daily moving average @ 18.214
| Trends | Trends.1 | |
|---|---|---|
| 0 | Daily SMA20 | 16.9912 |
| 1 | Daily SMA50 | 17.0384 |
| 2 | Daily SMA100 | 17.4500 |
| 3 | Daily SMA200 | 18.2140 |
The previous day high was 17.1684 while the previous day low was 17.0329. The daily 38.2% Fib levels comes at 17.0847, expected to provide support. Similarly, the daily 61.8% fib level is at 17.1167, expected to provide support.
Note the levels of interest below:
- Pivot support is noted at 17.0557, 16.9766, 16.9202
- Pivot resistance is noted at 17.1912, 17.2476, 17.3267
| Levels | Levels.1 |
|---|---|
| Previous Daily High | 17.1684 |
| Previous Daily Low | 17.0329 |
| Previous Weekly High | 17.2852 |
| Previous Weekly Low | 16.9101 |
| Previous Monthly High | 17.3957 |
| Previous Monthly Low | 16.6258 |
| Daily Fibonacci 38.2% | 17.0847 |
| Daily Fibonacci 61.8% | 17.1167 |
| Daily Pivot Point S1 | 17.0557 |
| Daily Pivot Point S2 | 16.9766 |
| Daily Pivot Point S3 | 16.9202 |
| Daily Pivot Point R1 | 17.1912 |
| Daily Pivot Point R2 | 17.2476 |
| Daily Pivot Point R3 | 17.3267 |
[/s2If]
Download Nehcap EAWe have two EAs that are operational on our LIVE accounts.
- EA-FIX: Check out the details here. Download EA-FIX . EA-FIX is a non-grid HFT scalper.
- EA-GROWTH: High quality low dd EA using trend grids. Download EA_GROWTHJoin Our Telegram Group


