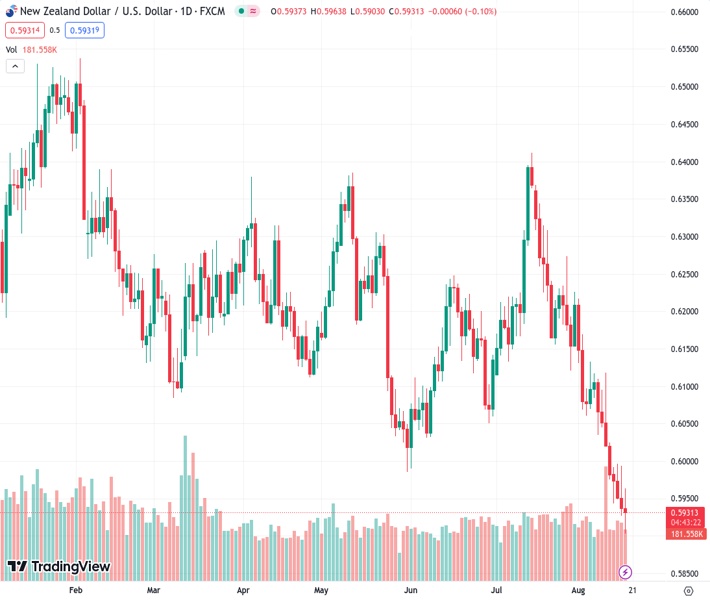
The NZDUSD currency pair is currently trading at around 0.5930, staying at the same level after experiencing a week of continuous declines.
…
This is a premium post.
[s2If !current_user_can(access_s2member_level4)]Please register for FREE REGISTER to read full post below containing analysis. In case of any error or you think you are not able to read the full post below, please email us at support#nehcap.com [lwa][/s2If] [s2If current_user_can(access_s2member_level1)]
- NZD/USD trades flat near 0.5930 after a consecutive week of losses.
The pair currently trades last at 0.59313.
The previous day high was 0.5994 while the previous day low was 0.5926. The daily 38.2% Fib levels comes at 0.5952, expected to provide resistance. Similarly, the daily 61.8% fib level is at 0.5968, expected to provide resistance.
On Thursday, the NZD/USD traded with mild losses near 0.5930. On the one hand, the US reported Jobless Claims data from the second week of August and seemed to get traction on the back of higher US yields after the release of the Federal Open Market Committee (FOMC) minutes from the July meeting. On the other hand, the NZD trades weak against most of its rivals amid the spooky outlook given by the Reserve Bank of New Zealand’s Governor.
On the data front, Jobless Claims for the second week of August came in lower than expected at 239,000 vs the 240,000 expected and lower from the previous weekly reading of 250,000. In addition, the Philadelphia Federal Reserve’s (Fed) manufacturing index came in higher than expected at 12 vs the expectations of -10.
What is driving to the upside, the USD is the US 10-year bond yield rising to its highest level since October 2022 at 4.28% while the other othe shorter-term yields stand at monthly highs with the 2 and 5-year rates at 4.95% and 4.40%, respectively. This could be attributed to higher tightening expectations for the Fed as the US economy holds firm, and the Federal Open Market Committee (FOMC) minutes from the July meeting showed that members were concerned with the upside risks of inflation and left the door open to another hike.
On the Kiwi’s side, the RBNZ held rates on Wednesday at 5.5%, as expected. Regarding forward guidance, the statement mentioned that the decisions would be data-driven and seem to have left the door open to another hike if inflation resurges. On the negative side, Governor Orr commented that a mild recession “is the bare minimum we need to see” to bring back inflation to target. In that sense, this negative outlook seems to be weighing on the NZD.
The current technical outlook for NZD/USD is bearish but as indicators are in oversold territory, it suggests a potential short-term technical recovery is on the horizon as buying pressure might increase. Exhibiting a pronounced downward trend below its midline, the Relative Strength Index (RSI) points to significant oversold conditions, while the Moving Average Convergence (MACD) histogram exhibits rising red bars. Also, the pair is below the 20,100 and 200-day Simple Moving Averages (SMAs), suggesting that the bears are firmly in control of the bigger picture. Additionally, the four-hour chart displays bearish indicators, highlighting a solid selling momentum and a clear bear dominance over the buyers.
Support levels: 0.5930, 0.5910, 0.5900.
Resistance levels: 0.6000, 0.6020, 0.6050.
Technical Levels: Supports and Resistances
NZDUSD currently trading at 0.5932 at the time of writing. Pair opened at 0.5937 and is trading with a change of -0.08 % .
| Overview | Overview.1 | |
|---|---|---|
| 0 | Today last price | 0.5932 |
| 1 | Today Daily Change | -0.0005 |
| 2 | Today Daily Change % | -0.0800 |
| 3 | Today daily open | 0.5937 |
The pair remains strongly bearish on the daily time frame. It trades below the 20 SMA @ 0.6103, 50 SMA 0.6158, 100 SMA @ 0.6176 and 200 SMA @ 0.6234.
| Trends | Trends.1 | |
|---|---|---|
| 0 | Daily SMA20 | 0.6103 |
| 1 | Daily SMA50 | 0.6158 |
| 2 | Daily SMA100 | 0.6176 |
| 3 | Daily SMA200 | 0.6234 |
The previous day high was 0.5994 while the previous day low was 0.5926. The daily 38.2% Fib levels comes at 0.5952, expected to provide resistance. Similarly, the daily 61.8% fib level is at 0.5968, expected to provide resistance.
Note the levels of interest below:
- Pivot support is noted at 0.5911, 0.5884, 0.5843
- Pivot resistance is noted at 0.5979, 0.602, 0.6047
| Levels | Levels.1 |
|---|---|
| Previous Daily High | 0.5994 |
| Previous Daily Low | 0.5926 |
| Previous Weekly High | 0.6118 |
| Previous Weekly Low | 0.5974 |
| Previous Monthly High | 0.6413 |
| Previous Monthly Low | 0.6120 |
| Daily Fibonacci 38.2% | 0.5952 |
| Daily Fibonacci 61.8% | 0.5968 |
| Daily Pivot Point S1 | 0.5911 |
| Daily Pivot Point S2 | 0.5884 |
| Daily Pivot Point S3 | 0.5843 |
| Daily Pivot Point R1 | 0.5979 |
| Daily Pivot Point R2 | 0.6020 |
| Daily Pivot Point R3 | 0.6047 |
[/s2If]
Download Nehcap EAWe have two EAs that are operational on our LIVE accounts.
- EA-FIX: Check out the details here. Download EA-FIX . EA-FIX is a non-grid HFT scalper.
- EA-GROWTH: High quality low dd EA using trend grids. Download EA_GROWTHJoin Our Telegram Group


