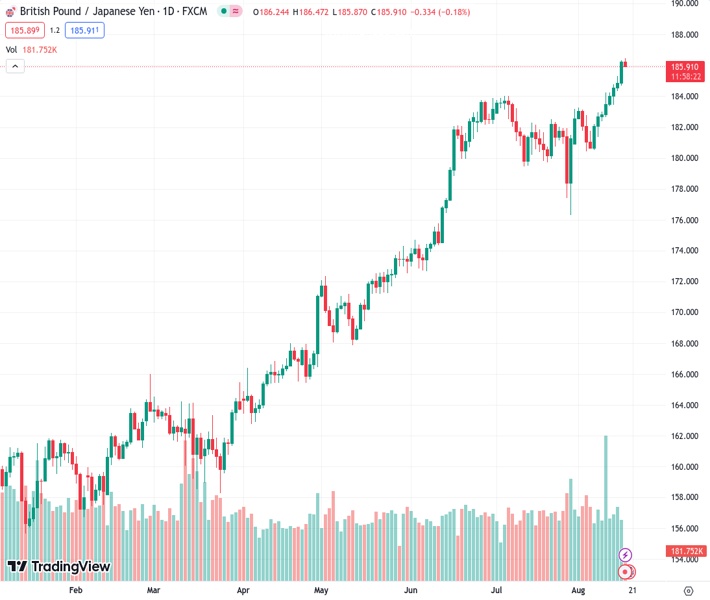
The GBPJPY currency pair retreats from a high point that has not been reached in several years due to an increase in demand for the JPY as a safe investment.
…
This is a premium post.
[s2If !current_user_can(access_s2member_level4)]Please register for FREE REGISTER to read full post below containing analysis. In case of any error or you think you are not able to read the full post below, please email us at support#nehcap.com [lwa][/s2If] [s2If current_user_can(access_s2member_level1)]
- GBP/JPY pulls back from a multi-year peak amid reviving demand for the safe-haven JPY.
The pair currently trades last at 185.938.
The previous day high was 186.35 while the previous day low was 184.7. The daily 38.2% Fib levels comes at 185.72, expected to provide support. Similarly, the daily 61.8% fib level is at 185.33, expected to provide support.
The GBP/JPY cross ticks lower after touching its highest level since November 2015, around the 186.45 area, this Thursday and trades with a mild negative bias during the early part of the European session. The supportive fundamental backdrop, however, assists spot prices to hold above the 186.00 mark and supports prospects for an extension of the recent breakout momentum through the 184.00 round figure, or the previous YTD peak.
Speculations that the recent weakness in the domestic currency might prompt some jawboning from Japanese authorities, or a possible intervention in the foreign exchange markets, along with the risk-off mood, benefits the safe-haven Japanese Yen (JPY). This, in turn, is seen as a key factor that caps the upside for the GBP/JPY cross. It is worth recalling Japan’s top forex diplomat Masato Kanda said on Tuesday that he would take appropriate steps against excessive currency moves. Meanwhile, concerns about the worsening economic conditions in China and fresh worries about headwinds stemming from rapidly rising borrowing costs revive recession fears. This, in turn, tempers investors’ appetite for riskier assets and drives some haven flows towards the JPY.
That said, a more dovish stance adopted by the Bank of Japan (BoJ), which is the only major central bank in the world to maintain negative interest rates, might keep a lid on any meaningful gains for the JPY. Moreover, policymakers have stressed that steps taken in July to make the BoJ’s Yield Curve Control (YCC) measures more flexible and allow yield on the 10-year Japanese government bond to move up toward 1% was a technical tweak aimed at extending the shelf life of stimulus. This marks a big divergence in comparison to other major central banks, including the Bank of England (BoE), which is expected to raise interest rates again at its next monetary policy meeting in September. The bets were reaffirmed by the stronger UK macro data released recently.
In fact, the UK jobs report showed on Tuesday that British wages grew at a record pace in the second quarter, which added to worries about long-term inflation. This, along with last week’s upbeat UK GDP report and Wednesday’s slightly higher-than-expected UK CPI print, should allow the BoE to continue tightening its monetary policy. This might continue to lend some support to the British Pound and suggests that the path of least resistance for the GBP/JPY cross is to the upside. Hence, any subsequent corrective slide might still be seen as a buying opportunity and is more likely to remain limited ahead of the UK retail Sales data on Friday.
Technical Levels: Supports and Resistances
GBPJPY currently trading at 186.2 at the time of writing. Pair opened at 186.33 and is trading with a change of -0.07 % .
| Overview | Overview.1 | |
|---|---|---|
| 0 | Today last price | 186.20 |
| 1 | Today Daily Change | -0.13 |
| 2 | Today Daily Change % | -0.07 |
| 3 | Today daily open | 186.33 |
The pair remains strongly bullish on the daily timeframe. It trades above its 20 SMA @ 182.41, 50 SMA 181.55, 100 SMA @ 175.37 and 200 SMA @ 168.87.
| Trends | Trends.1 | |
|---|---|---|
| 0 | Daily SMA20 | 182.41 |
| 1 | Daily SMA50 | 181.55 |
| 2 | Daily SMA100 | 175.37 |
| 3 | Daily SMA200 | 168.87 |
The previous day high was 186.35 while the previous day low was 184.7. The daily 38.2% Fib levels comes at 185.72, expected to provide support. Similarly, the daily 61.8% fib level is at 185.33, expected to provide support.
Note the levels of interest below:
- Pivot support is noted at 185.24, 184.14, 183.58
- Pivot resistance is noted at 186.89, 187.45, 188.54
| Levels | Levels.1 |
|---|---|
| Previous Daily High | 186.35 |
| Previous Daily Low | 184.70 |
| Previous Weekly High | 184.25 |
| Previous Weekly Low | 180.58 |
| Previous Monthly High | 184.02 |
| Previous Monthly Low | 176.32 |
| Daily Fibonacci 38.2% | 185.72 |
| Daily Fibonacci 61.8% | 185.33 |
| Daily Pivot Point S1 | 185.24 |
| Daily Pivot Point S2 | 184.14 |
| Daily Pivot Point S3 | 183.58 |
| Daily Pivot Point R1 | 186.89 |
| Daily Pivot Point R2 | 187.45 |
| Daily Pivot Point R3 | 188.54 |
[/s2If]
Download Nehcap EAWe have two EAs that are operational on our LIVE accounts.
- EA-FIX: Check out the details here. Download EA-FIX . EA-FIX is a non-grid HFT scalper.
- EA-GROWTH: High quality low dd EA using trend grids. Download EA_GROWTHJoin Our Telegram Group


