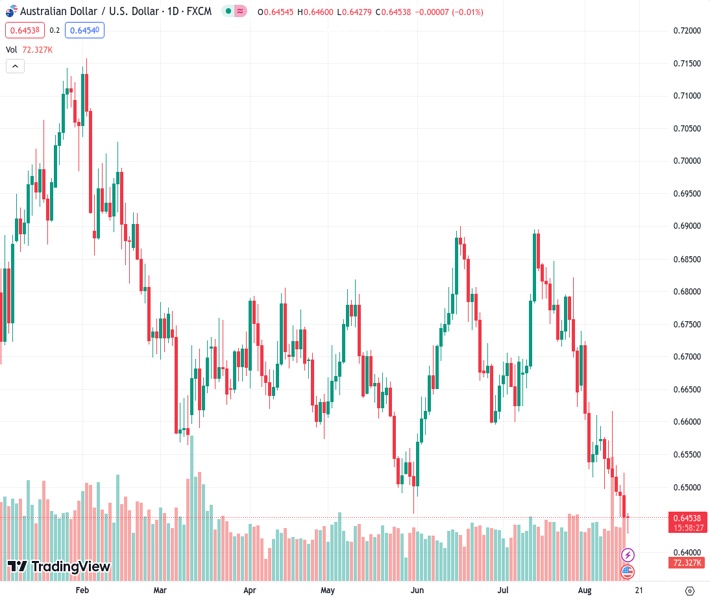
The AUDUSD pair, trading at a rate of 0.64519, experiences a small rebound from its lowest point of the year, which occurred earlier in the day on Wednesday.
…
This is a premium post.
[s2If !current_user_can(access_s2member_level4)]Please register for FREE REGISTER to read full post below containing analysis. In case of any error or you think you are not able to read the full post below, please email us at support#nehcap.com [lwa][/s2If] [s2If current_user_can(access_s2member_level1)]
- AUD/USD stages a modest recovery from a fresh YTD trough touched earlier this Wednesday.
The pair currently trades last at 0.64519.
The previous day high was 0.6522 while the previous day low was 0.6452. The daily 38.2% Fib levels comes at 0.6478, expected to provide resistance. Similarly, the daily 61.8% fib level is at 0.6495, expected to provide resistance.
The AUD/USD pair recovers a few pips from the 0.6430-0.6425 area, or a fresh low since November 2022 touched during the Asian session on Wednesday, albeit lacks follow-through. Spot prices currently trade around mid-0.6400s, still in the red for the seventh straight day, and seem vulnerable to prolonging the recent downward trajectory witnessed over the past month or so.
A softer tone surrounding the US Treasury bond yields keeps the US Dollar (USD) bulls on the defensive below a more than two-month top touched on Monday, which, in turn, is seen lending some support to the AUD/USD pair. Apart from this, a slightly oversold Relative Strength Index (RSI) on the daily chart prompts traders to take lighten their bearish bets and contributes to the modest intraday bounce. The downside for the USD, meanwhile, remains cushioned in the wake of growing acceptance that the Federal Reserve (Fed) will keep interest rates higher for longer.
It is worth mentioning that the US central bank is widely expected to pause the rate-hiking cycle at its upcoming policy meeting in September. The markets, however, are still pricing in the possibility of one more 25 bps lift-off by the end of this year and the bets were reaffirmed by the upbeat US Retail Sales data released on Tuesday, which indicated that consumer spending held up well in July. This, in turn, is likely to act as a tailwind for the US bond yields and the USD, which, along with concerns about the worsening economic conditions in China, should cap gains for the AUD/USD pair.
Another round of disappointing Chinese macro data released on Tuesday further fueled worries that the post-COVID recovery in the world’s second-largest economy has slowed after a brisk start in the first quarter. Even a surprise rate cut by the People’s Bank of China (PBoC) does little to boost investors’ confidence, warranting some caution before placing bullish bets around the China-proxy Australian Dollar (AUD). Hence, strong follow-through buying is needed to confirm that spot prices have formed a near-term bottom and positioning for any meaningful recovery.
Market participants now look to the US economic docket, featuring the release of Building Permits, Housing Starts and Industrial Production figures later during the early North American session. This, along with the US bond yields and the broader risk sentiment, might influence the USD price dynamics and provide some impetus to the AUD/USD pair. The focus, however, will remain glued to the FOMC meeting minutes, which will be looked upon for cues about the Fed’s future rate-hike path and help determine the near-term trajectory for the Greenback.
Technical Levels: Supports and Resistances
AUDUSD currently trading at 0.6448 at the time of writing. Pair opened at 0.6455 and is trading with a change of -0.11 % .
| Overview | Overview.1 | |
|---|---|---|
| 0 | Today last price | 0.6448 |
| 1 | Today Daily Change | -0.0007 |
| 2 | Today Daily Change % | -0.1100 |
| 3 | Today daily open | 0.6455 |
The pair remains strongly bearish on the daily time frame. It trades below the 20 SMA @ 0.6626, 50 SMA 0.6693, 100 SMA @ 0.6678 and 200 SMA @ 0.6737.
| Trends | Trends.1 | |
|---|---|---|
| 0 | Daily SMA20 | 0.6626 |
| 1 | Daily SMA50 | 0.6693 |
| 2 | Daily SMA100 | 0.6678 |
| 3 | Daily SMA200 | 0.6737 |
The previous day high was 0.6522 while the previous day low was 0.6452. The daily 38.2% Fib levels comes at 0.6478, expected to provide resistance. Similarly, the daily 61.8% fib level is at 0.6495, expected to provide resistance.
Note the levels of interest below:
- Pivot support is noted at 0.643, 0.6405, 0.6359
- Pivot resistance is noted at 0.6501, 0.6547, 0.6571
| Levels | Levels.1 |
|---|---|
| Previous Daily High | 0.6522 |
| Previous Daily Low | 0.6452 |
| Previous Weekly High | 0.6617 |
| Previous Weekly Low | 0.6486 |
| Previous Monthly High | 0.6895 |
| Previous Monthly Low | 0.6599 |
| Daily Fibonacci 38.2% | 0.6478 |
| Daily Fibonacci 61.8% | 0.6495 |
| Daily Pivot Point S1 | 0.6430 |
| Daily Pivot Point S2 | 0.6405 |
| Daily Pivot Point S3 | 0.6359 |
| Daily Pivot Point R1 | 0.6501 |
| Daily Pivot Point R2 | 0.6547 |
| Daily Pivot Point R3 | 0.6571 |
[/s2If]
Download Nehcap EAWe have two EAs that are operational on our LIVE accounts.
- EA-FIX: Check out the details here. Download EA-FIX . EA-FIX is a non-grid HFT scalper.
- EA-GROWTH: High quality low dd EA using trend grids. Download EA_GROWTHJoin Our Telegram Group


