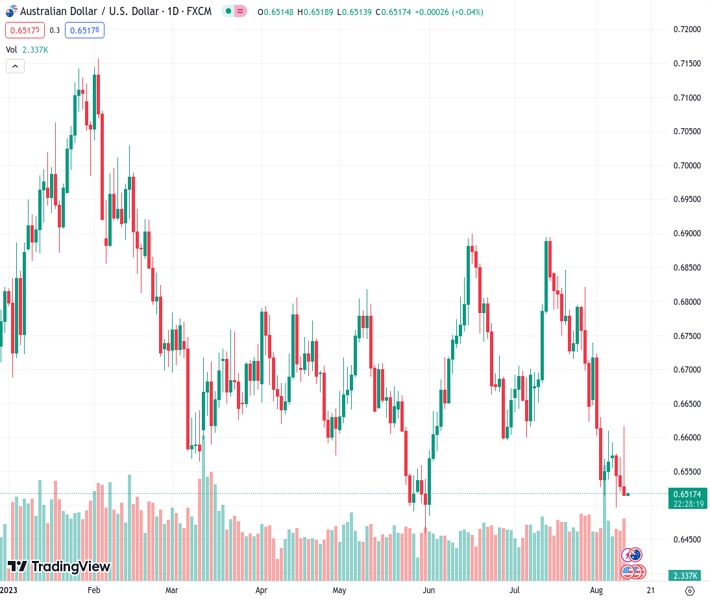
After a day of high volatility, the AUDUSD pair continues to experience downward pressure near its weekly low, with a current value of 0.65179.
…
This is a premium post.
[s2If !current_user_can(access_s2member_level4)]Please register for FREE REGISTER to read full post below containing analysis. In case of any error or you think you are not able to read the full post below, please email us at support#nehcap.com [lwa][/s2If] [s2If current_user_can(access_s2member_level1)]
- AUD/USD remains pressured around weekly low after a volatile day.
The pair currently trades last at 0.65179.
The previous day high was 0.6571 while the previous day low was 0.652. The daily 38.2% Fib levels comes at 0.654, expected to provide resistance. Similarly, the daily 61.8% fib level is at 0.6552, expected to provide resistance.
AUD/USD bears keep the driver’s seat after a whippy day as the quote stays depressed at 0.6515 during the early hours of Friday morning in Asia. The Aussie pair refreshed the weekly high to near 0.6620 after the US inflation data initially triggered the US Dollar’s slump and helped Antipodeans rise. However, a second reading of the same and a slew of Fed policymakers’ efforts to cheer the victory against the US inflation raised doubts about the US data, which in turn joined a jump in the Treasury bond yields to drown the Aussie pair during late Thursday.
On Thursday, the US Consumer Price Index (CPI) for July matched market forecasts to reprint 0.2% MoM figures. However, the yearly CPI improved slower-than-expected 3.3% to 3.2% YoY for the said month, versus 3.0% previous readings, marking the first acceleration in the annual rate in 13 months. Furthermore, the CPI ex Food & Energy, also known as the Core CPI, also flashed an unchanged 0.20% MoM figures while meeting market consensus but eased to 4.7% YoY compared to 4.8% marked in June and the expected numbers.
Elsewhere, the US Initial Jobless Claims rose to 248K for the week ended on August 04 versus 230K expected and 227K prior while Continuing Jobless Claims softened to 1.684M from 1.692M (revised), versus 1.71M market forecasts.
Following the data, Philadelphia Federal Reserve Bank President Patrick Harker cited the Fed’s progress in its fight against inflation and was joined by Boston Federal Reserve President Susan Collins and Atlanta Federal Reserve Bank President Raphael Bostic to cheer the softer US CPI. However, San Francisco Fed President Daly turned down the cheers for their victory while saying, “There’s still more work to do.”
Elsewhere, Australia’s Consumer Inflation Expectations for August tracked downbeat China inflation clues and exerted downside pressure on the Aussie pair during early Thursday. On the same line were fears that the UK and European Union will also follow the US in limiting investment in China technology companies. Though, the market’s fears were limited as these measures were already discussed and known. Further, the Chinese policymakers’ readiness to take more steps to defend their economy also favored the AUD/USD during early Thursday.
Amid these plays, the US Dollar Index (DXY) marked a positive daily closing around 102.62, after initially declining to the one-week low, whereas the US 10-year Treasury bond yields jumped the most in a week to 4.10% at the latest. Even so, Wall Street managed to end the day on a positive side, despite trimming gains by the day’s end.
Moving on, the US Producer Price Index (PPI) for July will precede the first readings of the University of Michigan’s (UoM) Consumer Sentiment Index (CSI) for August to direct intraday AUD/USD moves. Also important will be the UoM 5-Year Consumer Inflation Expectations for the said month. Above all, the central bank updates and China news will be crucial to determine the pair’s further direction.
A clear downside break of a 10-month-old rising support line, now resistance near 0.6550, directs AUD/USD towards an upward-sloping trend line from November 2022, close to 0.6480 at the latest.
Technical Levels: Supports and Resistances
AUDUSD currently trading at 0.6518 at the time of writing. Pair opened at 0.6528 and is trading with a change of -0.15% % .
| Overview | Overview.1 | |
|---|---|---|
| 0 | Today last price | 0.6518 |
| 1 | Today Daily Change | -0.0010 |
| 2 | Today Daily Change % | -0.15% |
| 3 | Today daily open | 0.6528 |
The pair remains strongly bearish on the daily time frame. It trades below the 20 SMA @ 0.6696, 50 SMA 0.6703, 100 SMA @ 0.6685 and 200 SMA @ 0.6736.
| Trends | Trends.1 | |
|---|---|---|
| 0 | Daily SMA20 | 0.6696 |
| 1 | Daily SMA50 | 0.6703 |
| 2 | Daily SMA100 | 0.6685 |
| 3 | Daily SMA200 | 0.6736 |
The previous day high was 0.6571 while the previous day low was 0.652. The daily 38.2% Fib levels comes at 0.654, expected to provide resistance. Similarly, the daily 61.8% fib level is at 0.6552, expected to provide resistance.
Note the levels of interest below:
- Pivot support is noted at 0.6508, 0.6488, 0.6457
- Pivot resistance is noted at 0.656, 0.6591, 0.6611
| Levels | Levels.1 |
|---|---|
| Previous Daily High | 0.6571 |
| Previous Daily Low | 0.6520 |
| Previous Weekly High | 0.6740 |
| Previous Weekly Low | 0.6514 |
| Previous Monthly High | 0.6895 |
| Previous Monthly Low | 0.6599 |
| Daily Fibonacci 38.2% | 0.6540 |
| Daily Fibonacci 61.8% | 0.6552 |
| Daily Pivot Point S1 | 0.6508 |
| Daily Pivot Point S2 | 0.6488 |
| Daily Pivot Point S3 | 0.6457 |
| Daily Pivot Point R1 | 0.6560 |
| Daily Pivot Point R2 | 0.6591 |
| Daily Pivot Point R3 | 0.6611 |
[/s2If]
Download Nehcap EAWe have two EAs that are operational on our LIVE accounts.
- EA-FIX: Check out the details here. Download EA-FIX . EA-FIX is a non-grid HFT scalper.
- EA-GROWTH: High quality low dd EA using trend grids. Download EA_GROWTHJoin Our Telegram Group
")


