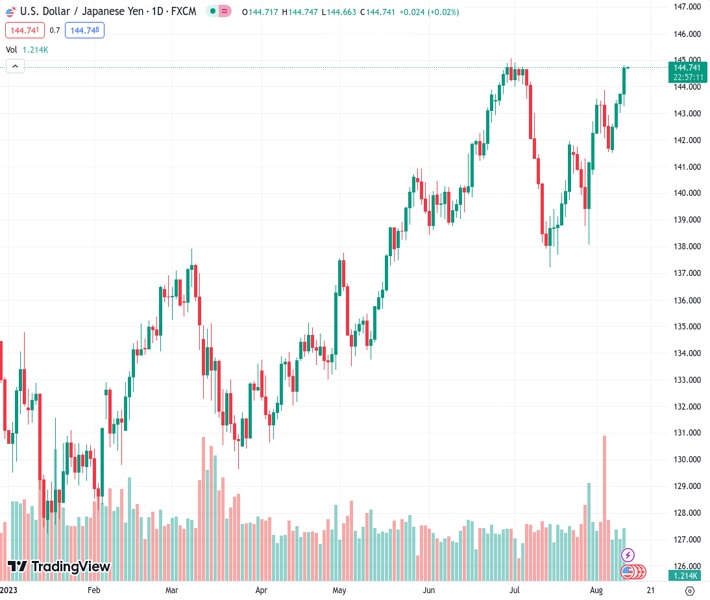
The USDJPY currency pair experienced positive movement in the last four days, consistently gaining, and ultimately finishing near the crucial resistance level of 145.00.
…
This is a premium post.
[s2If !current_user_can(access_s2member_level4)]Please register for FREE REGISTER to read full post below containing analysis. In case of any error or you think you are not able to read the full post below, please email us at support#nehcap.com [lwa][/s2If] [s2If current_user_can(access_s2member_level1)]
- The pair saw green for 4 consecutive days of gains and close near the 145.00 critical resistance.
The pair currently trades last at 144.703.
The previous day high was 143.75 while the previous day low was 143.0. The daily 38.2% Fib levels comes at 143.46, expected to provide support. Similarly, the daily 61.8% fib level is at 143.29, expected to provide support.
At the end of Thursday’s session, the USD/JPY jumped to a monthly high and closed near the 144.80 area, seeing more than 0.40% of daily gains. This could be justified by disappointing Japan’s inflation figures released for July, which pressured the Yen, as investors placed dovish bets by the Bank of Japan (BoJ). On the US side, the weak Consumer Price Index figures from July capped the USD gains but traded resilient against its rivals. Investors await Producer Price Index (PPI) data from the US from July on Friday to have a better understanding of the inflation outlook of the US to place their bets on the next Federal Reserve (Fed) decisions.
After July’s headline CPI from the US decreased to 3.2% YoY and the Core measure to 4.7%, investors foresee PPI from the same month falling to 2.3%. In that sense, additional evidence of inflation decelerating may fuel more dovish bets on the USD and limit the pair’s upside momentum.
However, on the Japanese side, July’s PPI advanced 0.1%, lower than the 0.2% expected. It’s worth mentioning that the BoJ express that as long as inflation doesn’t meet the bank’s forecast, they won’t leave their dovish stance, so monetary policy divergences may continue to pressure the JPY.
Per the daily chart analysis, the USD/JPY has a bullish technical bias for the short term, with Relative Strength Index (RSI) and Moving Average Convergence Divergence (MACD) residing in positive territory. The Relative Strength Index (RSI) also exhibits a northward slope above its midline, emphasising the presence of intense buying pressure. At the same time, the MACD, with its green bars, highlights the strengthening bullish momentum of the USD/JPY. Also, the pair is above the 20,100,200-day Simple Moving Average (SMAs), implying that the bulls retain control on a broader scale.
Support levels: 144.50, 144.00, 142.00.
Resistance levels: 145.00, 145.50, 146.00.
Technical Levels: Supports and Resistances
USDJPY currently trading at 144.72 at the time of writing. Pair opened at 143.73 and is trading with a change of 0.69 % .
| Overview | Overview.1 | |
|---|---|---|
| 0 | Today last price | 144.72 |
| 1 | Today Daily Change | 0.99 |
| 2 | Today Daily Change % | 0.69 |
| 3 | Today daily open | 143.73 |
The pair remains strongly bullish on the daily timeframe. It trades above its 20 SMA @ 141.1, 50 SMA 141.48, 100 SMA @ 138.23 and 200 SMA @ 136.5.
| Trends | Trends.1 | |
|---|---|---|
| 0 | Daily SMA20 | 141.10 |
| 1 | Daily SMA50 | 141.48 |
| 2 | Daily SMA100 | 138.23 |
| 3 | Daily SMA200 | 136.50 |
The previous day high was 143.75 while the previous day low was 143.0. The daily 38.2% Fib levels comes at 143.46, expected to provide support. Similarly, the daily 61.8% fib level is at 143.29, expected to provide support.
Note the levels of interest below:
- Pivot support is noted at 143.23, 142.74, 142.49
- Pivot resistance is noted at 143.98, 144.24, 144.73
| Levels | Levels.1 |
|---|---|
| Previous Daily High | 143.75 |
| Previous Daily Low | 143.00 |
| Previous Weekly High | 143.89 |
| Previous Weekly Low | 140.69 |
| Previous Monthly High | 144.91 |
| Previous Monthly Low | 137.24 |
| Daily Fibonacci 38.2% | 143.46 |
| Daily Fibonacci 61.8% | 143.29 |
| Daily Pivot Point S1 | 143.23 |
| Daily Pivot Point S2 | 142.74 |
| Daily Pivot Point S3 | 142.49 |
| Daily Pivot Point R1 | 143.98 |
| Daily Pivot Point R2 | 144.24 |
| Daily Pivot Point R3 | 144.73 |
[/s2If]
Download Nehcap EAWe have two EAs that are operational on our LIVE accounts.
- EA-FIX: Check out the details here. Download EA-FIX . EA-FIX is a non-grid HFT scalper.
- EA-GROWTH: High quality low dd EA using trend grids. Download EA_GROWTHJoin Our Telegram Group
")


