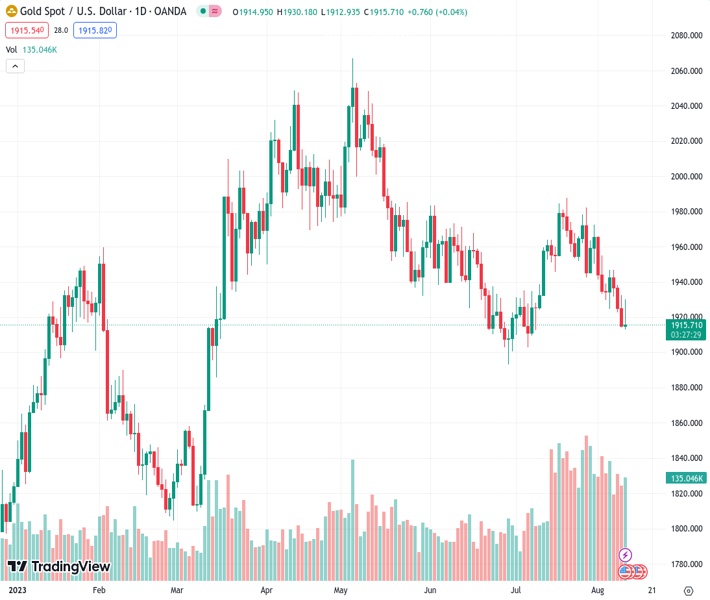
The price of gold, represented by #XAUUSD, increased significantly from its previous low point of approximately $1913.02 following the release of US inflation data.
…
This is a premium post.
[s2If !current_user_can(access_s2member_level4)]Please register for FREE REGISTER to read full post below containing analysis. In case of any error or you think you are not able to read the full post below, please email us at support#nehcap.com [lwa][/s2If] [s2If current_user_can(access_s2member_level1)]
- Gold price surged from its lows of around $1913.02 after US inflation data.
The pair currently trades last at 1916.34.
The previous day high was 1932.43 while the previous day low was 1914.11. The daily 38.2% Fib levels comes at 1921.11, expected to provide resistance. Similarly, the daily 61.8% fib level is at 1925.43, expected to provide resistance.
Gold price advances more than 0.20% following an inflation report from the United States (US) showing that prices are getting lower, easing pressure on the US Federal Reserve (Fed), which has been increasing rates to bring inflation towards its 2% target. Hence, XAU/USD jumped from its daily lows of $1,913.02, exchanging hands at $1,920.00 a troy ounce.
Gold extended its gains early in the day but is trimming some of those after the greenback recovers some ground as US Treasury bond yields advance. The latest inflation report for July in the US showed the Consumer Price Index (CPI) jumping by 3.2% YoY, below estimates and exceeded June’s 3% dip. Core CPI for the same period rose by 4.7% YoY, less than estimates, and the prior month by 4.8%.
Initially, the data bolstered XAU/USD towards the $1930 area; since then, XAU/USD has extended its losses, as the 10-year benchmark note peaks at 4.047%, gaining one and a half basis points (bps).
Other data revealed by the US Bureau of Labor Statistics (BLS), portrayed the labor market easing after Initial Jobless Claims for the week ending July 29 exceeded forecasts of 230K, advanced 248K.
After the data, traders slashed bets the Fed would raise rates again, as shown by money market futures. The CME FedWatch Tools portrays the chances for a rate hike in September below 10%, while for the November meeting, it dropped to 23.6% from 33.8% a month ago.
The San Francisco Fed President Mary Daly recently stated that CPI data was good news. Still, the July report did not imply Fed’s victory n inflation, while stressing she’s data dependent and supported the last month’s Fed rate hike. She pushed back against easing monetary conditions, saying there’s a “long way from a conversation about rate cuts.”
From a technical standpoint, the XAU/USD remains neutrally biased but set to extend its losses toward the $1900 psychological figure. Still, first, it would need to crack the 200-day Exponential Moving Average (EMA) at $1908.19. A breach of the daily low of $1913.02 would expose the latter, followed by the former. At that point, XAU/USD would shift bearish, and it might extend its losses to test June’s low of $1893.12, ahead o diving toward the March 6 high turned support at $1858.33. Conversely, XAU/USD’s reclaiming $1932.36 could open the door to test the confluence of the 100 and 20-day EMAs, each at $1939.75 and $1940.49.
Technical Levels: Supports and Resistances
XAUUSD currently trading at 1918.23 at the time of writing. Pair opened at 1914.2 and is trading with a change of 0.21 % .
| Overview | Overview.1 | |
|---|---|---|
| 0 | Today last price | 1918.23 |
| 1 | Today Daily Change | 4.03 |
| 2 | Today Daily Change % | 0.21 |
| 3 | Today daily open | 1914.20 |
The pair is trading below its 20 Daily moving average @ 1952.6, below its 50 Daily moving average @ 1943.38 , below its 100 Daily moving average @ 1967.77 and above its 200 Daily moving average @ 1899.15
| Trends | Trends.1 | |
|---|---|---|
| 0 | Daily SMA20 | 1952.60 |
| 1 | Daily SMA50 | 1943.38 |
| 2 | Daily SMA100 | 1967.77 |
| 3 | Daily SMA200 | 1899.15 |
The previous day high was 1932.43 while the previous day low was 1914.11. The daily 38.2% Fib levels comes at 1921.11, expected to provide resistance. Similarly, the daily 61.8% fib level is at 1925.43, expected to provide resistance.
Note the levels of interest below:
- Pivot support is noted at 1908.06, 1901.93, 1889.74
- Pivot resistance is noted at 1926.38, 1938.57, 1944.7
| Levels | Levels.1 |
|---|---|
| Previous Daily High | 1932.43 |
| Previous Daily Low | 1914.11 |
| Previous Weekly High | 1972.45 |
| Previous Weekly Low | 1925.72 |
| Previous Monthly High | 1987.54 |
| Previous Monthly Low | 1902.77 |
| Daily Fibonacci 38.2% | 1921.11 |
| Daily Fibonacci 61.8% | 1925.43 |
| Daily Pivot Point S1 | 1908.06 |
| Daily Pivot Point S2 | 1901.93 |
| Daily Pivot Point S3 | 1889.74 |
| Daily Pivot Point R1 | 1926.38 |
| Daily Pivot Point R2 | 1938.57 |
| Daily Pivot Point R3 | 1944.70 |
[/s2If]
Download Nehcap EAWe have two EAs that are operational on our LIVE accounts.
- EA-FIX: Check out the details here. Download EA-FIX . EA-FIX is a non-grid HFT scalper.
- EA-GROWTH: High quality low dd EA using trend grids. Download EA_GROWTHJoin Our Telegram Group
")


