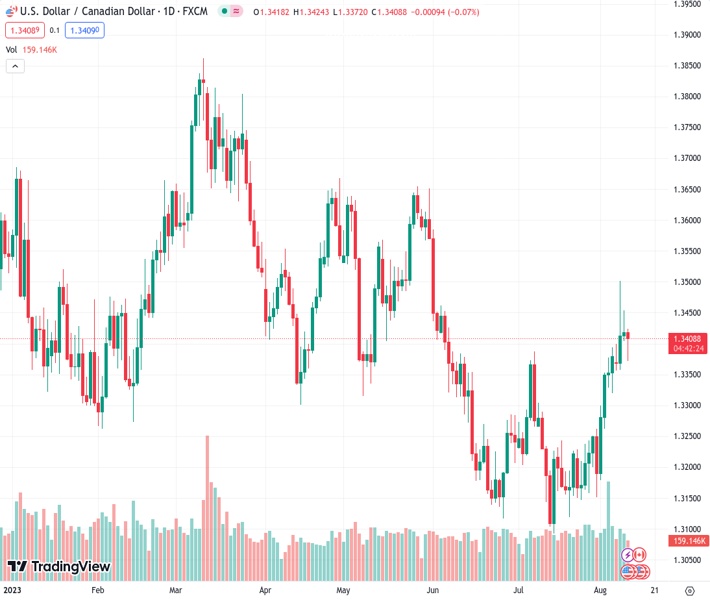
The USDCAD currency pair is currently trading at a level of 1.34067 with slight losses, hovering around the 1.3400 mark. Bulls are currently fighting to protect the 100-day Simple Moving Average (SMA) at a level of 1.3390.
…
This is a premium post.
[s2If !current_user_can(access_s2member_level4)]Please register for FREE REGISTER to read full post below containing analysis. In case of any error or you think you are not able to read the full post below, please email us at support#nehcap.com [lwa][/s2If] [s2If current_user_can(access_s2member_level1)]
- USD/CAD trades with losses near 1.3400 as bulls battle to defend the 100-day SMA at 1.3390.
The pair currently trades last at 1.34067.
The previous day high was 1.3454 while the previous day low was 1.3404. The daily 38.2% Fib levels comes at 1.3435, expected to provide resistance. Similarly, the daily 61.8% fib level is at 1.3423, expected to provide resistance.
On Thursday, the USD/CAD retreated towards the 1.3400 area but still holds above the critical support of the 100-day Simple Moving Average (SMA) of 1.3390. On the USD side, soft inflation data made the Greenback retreat while the CAD suffered Oil prices correction overbought conditions.
The US Bureau of Labor Statistics revealed that the Consumer Price Index (CPI) from the US from July advanced by 0.2% MoM, just as expected, and the yearly measure dropped to 3.2% YoY vs the 3.3% expected. The Core measure also advanced 0.2% in the same month as scheduled, with the YoY measure dropping by 4.7%, lower than the 4.8% expected. In addition, Jobless Claims for the first week of August increased to 248,000, higher than the expected 230,000 and the previous figure of 227,000 and gave another signal of the labour market cooling off.
As a reaction, the US bond yields have weakened across the curve. The 10-year bond yield fell to 4.01%, while the 2-year yield sits at 4.77% and the 5-year yielding 4.12%. Downward movements reflect dovish bets on the Federal Reserve (Fed), and according to the CME FedWatch tool, markets are confident that the Fed won’t hike either in September or in November. However, incoming data will be the ones which shape the next monetary policy decisions.
The daily chart shows exhaustion for the USD/CAD’s bulls. The Relative Strength Index (RSI) displays a negative slope but stands above its midline, while the Moving Average Convergence (MACD) prints decreasing green bars. On the bigger picture, the pair is above the 20 and 100-day Simple Moving Averages (SMA) but below the 200-day SMA, highlighting the continued dominance of bulls in the broader perspective. However, buyers must soon overcome the 200-day SMA to confirm an upward trajectory.
Support levels: 1.3380 (100-day SMA),1.3350, 1.3300.
Resistance levels: 1.3450, 1.3500 (200-day SMA), 1.3550.
Technical Levels: Supports and Resistances
USDCAD currently trading at 1.3403 at the time of writing. Pair opened at 1.3419 and is trading with a change of -0.12 % .
| Overview | Overview.1 | |
|---|---|---|
| 0 | Today last price | 1.3403 |
| 1 | Today Daily Change | -0.0016 |
| 2 | Today Daily Change % | -0.1200 |
| 3 | Today daily open | 1.3419 |
The pair is trading above its 20 Daily moving average @ 1.3252, above its 50 Daily moving average @ 1.3268 , above its 100 Daily moving average @ 1.3393 and below its 200 Daily moving average @ 1.3452
| Trends | Trends.1 | |
|---|---|---|
| 0 | Daily SMA20 | 1.3252 |
| 1 | Daily SMA50 | 1.3268 |
| 2 | Daily SMA100 | 1.3393 |
| 3 | Daily SMA200 | 1.3452 |
The previous day high was 1.3454 while the previous day low was 1.3404. The daily 38.2% Fib levels comes at 1.3435, expected to provide resistance. Similarly, the daily 61.8% fib level is at 1.3423, expected to provide resistance.
Note the levels of interest below:
- Pivot support is noted at 1.3397, 1.3376, 1.3347
- Pivot resistance is noted at 1.3447, 1.3476, 1.3497
| Levels | Levels.1 |
|---|---|
| Previous Daily High | 1.3454 |
| Previous Daily Low | 1.3404 |
| Previous Weekly High | 1.3394 |
| Previous Weekly Low | 1.3151 |
| Previous Monthly High | 1.3387 |
| Previous Monthly Low | 1.3093 |
| Daily Fibonacci 38.2% | 1.3435 |
| Daily Fibonacci 61.8% | 1.3423 |
| Daily Pivot Point S1 | 1.3397 |
| Daily Pivot Point S2 | 1.3376 |
| Daily Pivot Point S3 | 1.3347 |
| Daily Pivot Point R1 | 1.3447 |
| Daily Pivot Point R2 | 1.3476 |
| Daily Pivot Point R3 | 1.3497 |
[/s2If]
Download Nehcap EAWe have two EAs that are operational on our LIVE accounts.
- EA-FIX: Check out the details here. Download EA-FIX . EA-FIX is a non-grid HFT scalper.
- EA-GROWTH: High quality low dd EA using trend grids. Download EA_GROWTHJoin Our Telegram Group
")


