The USDJPY exchange rate experienced a decline following the release of US inflation data, but later recovered some of its losses.
…
This is a premium post.
[s2If !current_user_can(access_s2member_level4)]Please register for FREE REGISTER to read full post below containing analysis. In case of any error or you think you are not able to read the full post below, please email us at support#nehcap.com [lwa][/s2If] [s2If current_user_can(access_s2member_level1)]
- US Dollar tumbles after US inflation data but then trims losses.
The pair currently trades last at 144.108.
The previous day high was 143.75 while the previous day low was 143.0. The daily 38.2% Fib levels comes at 143.46, expected to provide support. Similarly, the daily 61.8% fib level is at 143.29, expected to provide support.
The USD/JPY is currently hovering around the same level it was before the release of the US inflation and jobless claims data, around 143.80. Immediately after the reports, the pair tumbled to 143.27, but as time passed, it managed to recover all the lost ground.
The US Consumer Price Index (CPI) for July increased by 0.2%, which was in line with expectations. The annual rate rebounded from 3% to 3.2%, slightly below the market consensus of 3.3%. The Core CPI also rose by 0.2%, matching estimates, while the annual rate slowed from 4.8% to 4.7%.
In a separate report, the Labor Department informed that Initial Jobless Claims rose from 227,000 to 248,000, surpassing market estimates and reaching the highest level in five weeks.
Following these numbers, US yields experienced a sharp drop, and the US Dollar Index (DXY) fell to 101.77, reaching its lowest level since last Friday. However, the US Dollar recovered most of its CPI-driven losses, with the DXY rising back above 102.00.
After the report, the pair reached a low point at 143.27, slightly above the 20-period Simple Moving Average on the 4-hour chart. The initial weakness after the data has turned into a potential reversal.
The pair now faces immediate resistance at 143.90, and if it consolidates above that level, it could potentially reach the five-week high of 144.10 (Aug 10 high). On the other hand, if the pair falls below 143.50, the bearish momentum is likely to intensify.
Technical Levels: Supports and Resistances
USDJPY currently trading at 143.82 at the time of writing. Pair opened at 143.73 and is trading with a change of 0.06 % .
| Overview | Overview.1 | |
|---|---|---|
| 0 | Today last price | 143.82 |
| 1 | Today Daily Change | 0.09 |
| 2 | Today Daily Change % | 0.06 |
| 3 | Today daily open | 143.73 |
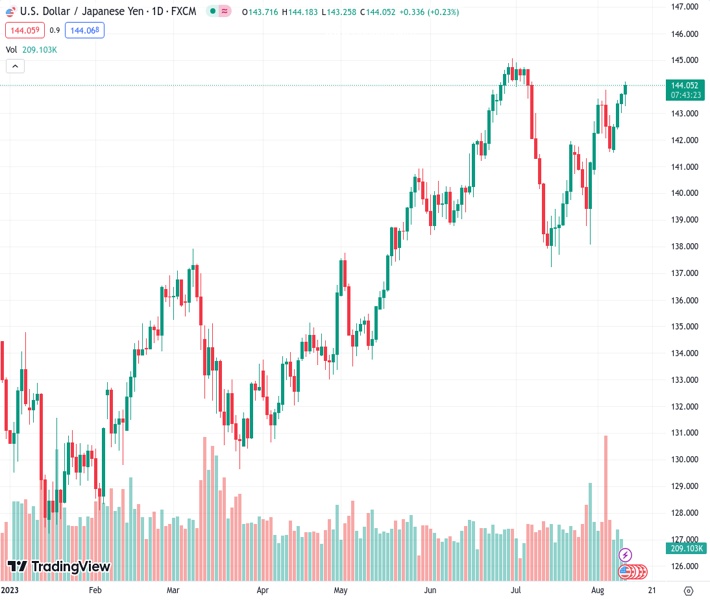
The pair remains strongly bullish on the daily timeframe. It trades above its 20 SMA @ 141.1, 50 SMA 141.48, 100 SMA @ 138.23 and 200 SMA @ 136.5.
| Trends | Trends.1 | |
|---|---|---|
| 0 | Daily SMA20 | 141.10 |
| 1 | Daily SMA50 | 141.48 |
| 2 | Daily SMA100 | 138.23 |
| 3 | Daily SMA200 | 136.50 |
The previous day high was 143.75 while the previous day low was 143.0. The daily 38.2% Fib levels comes at 143.46, expected to provide support. Similarly, the daily 61.8% fib level is at 143.29, expected to provide support.
Note the levels of interest below:
- Pivot support is noted at 143.23, 142.74, 142.49
- Pivot resistance is noted at 143.98, 144.24, 144.73
| Levels | Levels.1 |
|---|---|
| Previous Daily High | 143.75 |
| Previous Daily Low | 143.00 |
| Previous Weekly High | 143.89 |
| Previous Weekly Low | 140.69 |
| Previous Monthly High | 144.91 |
| Previous Monthly Low | 137.24 |
| Daily Fibonacci 38.2% | 143.46 |
| Daily Fibonacci 61.8% | 143.29 |
| Daily Pivot Point S1 | 143.23 |
| Daily Pivot Point S2 | 142.74 |
| Daily Pivot Point S3 | 142.49 |
| Daily Pivot Point R1 | 143.98 |
| Daily Pivot Point R2 | 144.24 |
| Daily Pivot Point R3 | 144.73 |
[/s2If]
Download Nehcap EAWe have two EAs that are operational on our LIVE accounts.
- EA-FIX: Check out the details here. Download EA-FIX . EA-FIX is a non-grid HFT scalper.
- EA-GROWTH: High quality low dd EA using trend grids. Download EA_GROWTHJoin Our Telegram Group
")


