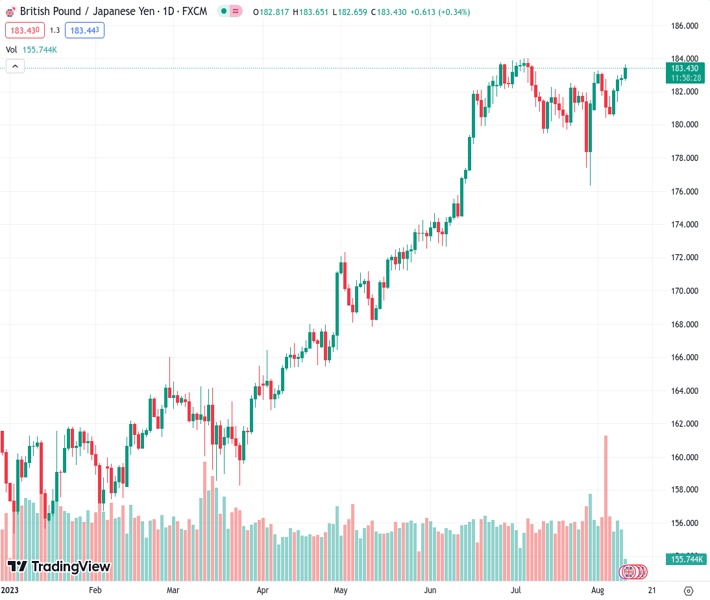
The GBPJPY pair, currently trading at 183.464, shows significant momentum on Thursday and rises to its highest level in over a month.
…
This is a premium post.
[s2If !current_user_can(access_s2member_level4)]Please register for FREE REGISTER to read full post below containing analysis. In case of any error or you think you are not able to read the full post below, please email us at support#nehcap.com [lwa][/s2If] [s2If current_user_can(access_s2member_level1)]
- GBP/JPY gains strong follow-through traction on Thursday and climbs to over a one-month top.
The pair currently trades last at 183.464.
The previous day high was 183.02 while the previous day low was 182.37. The daily 38.2% Fib levels comes at 182.77, expected to provide support. Similarly, the daily 61.8% fib level is at 182.62, expected to provide support.
The GBP/JPY cross prolongs its upward trajectory witnessed since the beginning of the current week and climbs to over a one-month top during the early part of the European session on Thursday. Spot prices currently trade just above mid-183.00s and might now aim to retest the highest level since December 2015 touched last month.
A positive turnaround in the global risk sentiment – as depicted by a generally positive tone around the equity markets – is seen undermining the safe-haven Japanese Yen (JPY). Apart from this, a dovish stance adopted by the Bank of Japan (BoJ) continues to weigh on the JPY. This, along with a pickup in demand for the British Pound (GBP), provides a goodish lift to the GBP/JPY cross, taking along short-term trading stops near the 183.00 mark.
It is worth recalling that the BoJ decided in July to make its Yield Curve Control (YCC) policy flexible, though policymakers have stressed that the change was a technical tweak aimed at extending the accommodative policy. Furthermore, weaker Japanese wage data released earlier this week reaffirmed market expectations that the Japanese central bank will maintain its ultra-low/negative interest rates over the rest of the year.
Furthermore, the BoJ, in the Summary of Opinions from the July 28 meeting, said that it still has a significantly long way to go before revising its stance on the negative rate policy. This marks a big divergence in comparison to the Bank of England’s (BoE) relatively more hawkish guidance, saying that the MPC will ensure that Bank Rate is sufficiently restrictive for long enough for the inflation to return to the central bank’s 2% target.
The aforementioned supportive factors help offset a bleak outlook for the UK economy and continue to push the GBP/JPY cross higher. In fact, the National Institute of Economic and Social Research (NIESR) said earlier this week that it would take until the third quarter of 2024 for UK output to return to its pre-pandemic peak. The NIESR further added that there was a 60% risk of the government going to the polls during a recession.
Hence, the market focus will remain glued to the preliminary release of the UK Q2 GDP report, which will be accompanied by other key macro releases on Friday. The data will play a key role in influencing the British Pound (GBP) and determine the next leg of a directional move for the GBP/JPY cross. The fundamental backdrop, meanwhile, favours bulls and suggests that the path of least resistance for spot prices remains to the upside.
Technical Levels: Supports and Resistances
GBPJPY currently trading at 183.44 at the time of writing. Pair opened at 182.81 and is trading with a change of 0.34 % .
| Overview | Overview.1 | |
|---|---|---|
| 0 | Today last price | 183.44 |
| 1 | Today Daily Change | 0.63 |
| 2 | Today Daily Change % | 0.34 |
| 3 | Today daily open | 182.81 |
The pair remains strongly bullish on the daily timeframe. It trades above its 20 SMA @ 181.55, 50 SMA 180.47, 100 SMA @ 174.22 and 200 SMA @ 168.43.
| Trends | Trends.1 | |
|---|---|---|
| 0 | Daily SMA20 | 181.55 |
| 1 | Daily SMA50 | 180.47 |
| 2 | Daily SMA100 | 174.22 |
| 3 | Daily SMA200 | 168.43 |
The previous day high was 183.02 while the previous day low was 182.37. The daily 38.2% Fib levels comes at 182.77, expected to provide support. Similarly, the daily 61.8% fib level is at 182.62, expected to provide support.
Note the levels of interest below:
- Pivot support is noted at 182.44, 182.08, 181.79
- Pivot resistance is noted at 183.1, 183.39, 183.75
| Levels | Levels.1 |
|---|---|
| Previous Daily High | 183.02 |
| Previous Daily Low | 182.37 |
| Previous Weekly High | 183.25 |
| Previous Weekly Low | 180.46 |
| Previous Monthly High | 184.02 |
| Previous Monthly Low | 176.32 |
| Daily Fibonacci 38.2% | 182.77 |
| Daily Fibonacci 61.8% | 182.62 |
| Daily Pivot Point S1 | 182.44 |
| Daily Pivot Point S2 | 182.08 |
| Daily Pivot Point S3 | 181.79 |
| Daily Pivot Point R1 | 183.10 |
| Daily Pivot Point R2 | 183.39 |
| Daily Pivot Point R3 | 183.75 |
[/s2If]
Download Nehcap EAWe have two EAs that are operational on our LIVE accounts.
- EA-FIX: Check out the details here. Download EA-FIX . EA-FIX is a non-grid HFT scalper.
- EA-GROWTH: High quality low dd EA using trend grids. Download EA_GROWTHJoin Our Telegram Group
")


