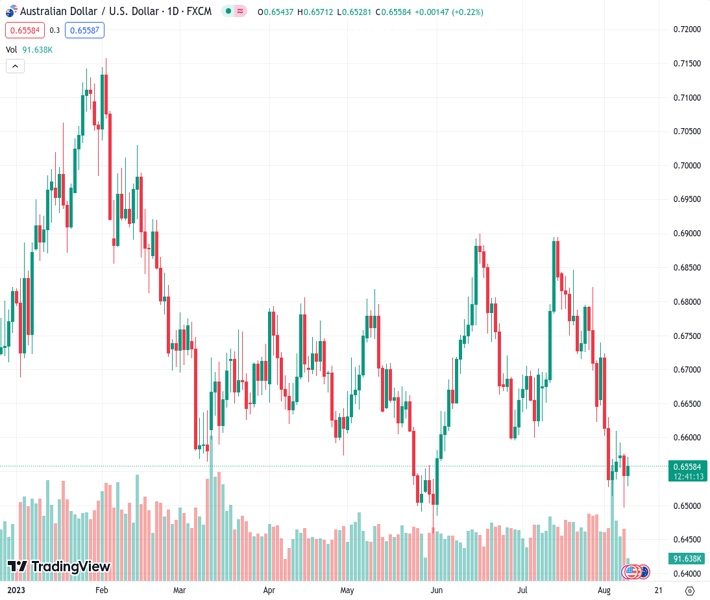
The AUDUSD pair, trading at 0.65609, gained interest from buyers on Wednesday and continued to rebound from its lowest point in over two months.
…
This is a premium post.
[s2If !current_user_can(access_s2member_level4)]Please register for FREE REGISTER to read full post below containing analysis. In case of any error or you think you are not able to read the full post below, please email us at support#nehcap.com [lwa][/s2If] [s2If current_user_can(access_s2member_level1)]
- AUD/USD attracts some buying on Wednesday and recovers further from over a two-month low.
The pair currently trades last at 0.65609.
The previous day high was 0.6576 while the previous day low was 0.6496. The daily 38.2% Fib levels comes at 0.6527, expected to provide support. Similarly, the daily 61.8% fib level is at 0.6546, expected to provide support.
The AUD/USD pair builds on the previous day’s goodish rebound from sub-0.6500 levels, or over a two-month low and gains some follow-through positive traction on Wednesday. Spot prices maintain the bid tone through the early part of the European session and currently trade around the 0.6560 region, just a few pips below the daily peak.
The US Dollar (USD) meets with a fresh supply and retreats further from the vicinity of its highest level since July 7 touched on Tuesday, which, in turn, is seen as a key factor pushing the AUD/USD pair higher. Philadelphia Federal Reserve Bank President Patrick Harker’s dovish remarks on Tuesday, along with a mildly softer tone surrounding the US Treasury bond yields, seem to undermine the buck. Apart from this, a stable performance around the global equity markets further dents the Greenback;’s relative safe-haven status and benefits the risk-sensitive Australian Dollar (AUD).
The upside potential for the AUD/USD pair, however, seems limited in the wake of the worsening economic conditions in China. The fears were further fueled by weaker Chinese inflation figures, showing that headline CPI turned negative for the first time since February 2021 and the Producer Price Index (PPI) falling for the 10th consecutive month, confirming deflation. This comes on the back of weaker trade data on Tuesday and suggests that the post-COVID recovery in the world’s second-largest economy is losing steam, which should act as a headwind for the China-proxy Aussie.
Traders might also refrain from placing aggressive USD bearish bets amid growing acceptance that the Fed will stick to its hawkish stance, which might further contribute to capping the AUD/USD pair. In fact, market participants still seem convinced that the US central bank will keep interest rates higher for longer in the wake of an extremely resilient economy. This, in turn, supports prospects for the emergence of some USD dip-buying and suggests that the path of least resistance for the AUD/USD pair is to the downside, warranting some caution before positioning for further gains.
In the absence of any relevant market-moving economic releases from the US, the fundamental backdrop makes it prudent to wait for strong follow-through buying before confirming that the AUD/USD pair has formed a near-term bottom. The market focus, meanwhile, remains glued to the latest US consumer inflation figures, due on Thursday. The crucial US CPI report will play a key role in influencing market expectations about the Fed’s future rate hike path, which, in turn, will drive the USD demand and help investors to determine the next leg of a directional move for the major.
Technical Levels: Supports and Resistances
AUDUSD currently trading at 0.6566 at the time of writing. Pair opened at 0.6544 and is trading with a change of 0.34 % .
| Overview | Overview.1 | |
|---|---|---|
| 0 | Today last price | 0.6566 |
| 1 | Today Daily Change | 0.0022 |
| 2 | Today Daily Change % | 0.3400 |
| 3 | Today daily open | 0.6544 |
The pair remains strongly bearish on the daily time frame. It trades below the 20 SMA @ 0.6709, 50 SMA 0.6703, 100 SMA @ 0.6687 and 200 SMA @ 0.6735.
| Trends | Trends.1 | |
|---|---|---|
| 0 | Daily SMA20 | 0.6709 |
| 1 | Daily SMA50 | 0.6703 |
| 2 | Daily SMA100 | 0.6687 |
| 3 | Daily SMA200 | 0.6735 |
The previous day high was 0.6576 while the previous day low was 0.6496. The daily 38.2% Fib levels comes at 0.6527, expected to provide support. Similarly, the daily 61.8% fib level is at 0.6546, expected to provide support.
Note the levels of interest below:
- Pivot support is noted at 0.6501, 0.6459, 0.6422
- Pivot resistance is noted at 0.6581, 0.6619, 0.6661
| Levels | Levels.1 |
|---|---|
| Previous Daily High | 0.6576 |
| Previous Daily Low | 0.6496 |
| Previous Weekly High | 0.6740 |
| Previous Weekly Low | 0.6514 |
| Previous Monthly High | 0.6895 |
| Previous Monthly Low | 0.6599 |
| Daily Fibonacci 38.2% | 0.6527 |
| Daily Fibonacci 61.8% | 0.6546 |
| Daily Pivot Point S1 | 0.6501 |
| Daily Pivot Point S2 | 0.6459 |
| Daily Pivot Point S3 | 0.6422 |
| Daily Pivot Point R1 | 0.6581 |
| Daily Pivot Point R2 | 0.6619 |
| Daily Pivot Point R3 | 0.6661 |
[/s2If]
Download Nehcap EAWe have two EAs that are operational on our LIVE accounts.
- EA-FIX: Check out the details here. Download EA-FIX . EA-FIX is a non-grid HFT scalper.
- EA-GROWTH: High quality low dd EA using trend grids. Download EA_GROWTHJoin Our Telegram Group
")


