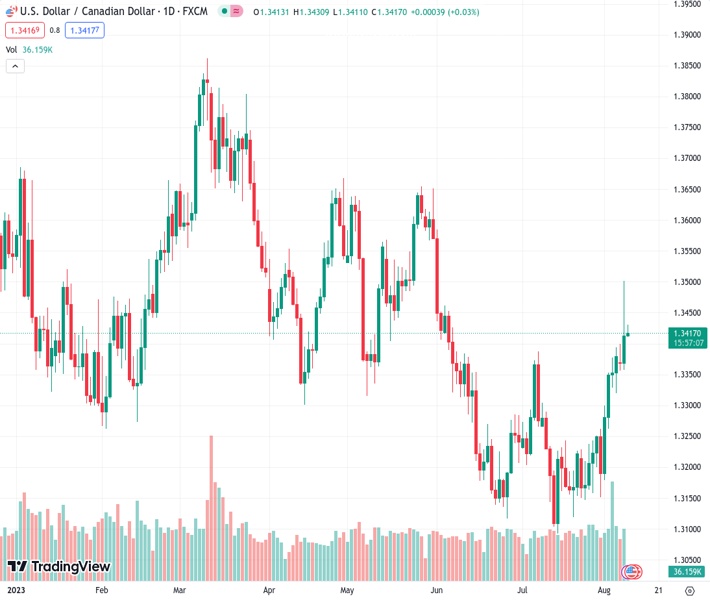
The USDCAD pair, trading at 1.34154, faces difficulty in making significant progress and remains within a particular range on Wednesday.
…
This is a premium post.
[s2If !current_user_can(access_s2member_level4)]Please register for FREE REGISTER to read full post below containing analysis. In case of any error or you think you are not able to read the full post below, please email us at support#nehcap.com [lwa][/s2If] [s2If current_user_can(access_s2member_level1)]
- USD/CAD struggles to gain any meaningful traction and oscillates in a range on Wednesday.
The pair currently trades last at 1.34154.
The previous day high was 1.3502 while the previous day low was 1.3365. The daily 38.2% Fib levels comes at 1.345, expected to provide resistance. Similarly, the daily 61.8% fib level is at 1.3417, expected to provide resistance.
The USD/CAD pair oscillates in a narrow trading band through the Asian session on Wednesday and currently trades around the 1.3415 region, nearly unchanged for the day. The overnight breakout through the 100-day Simple Moving Average (SMA), meanwhile, favours bulls and warrants caution before positioning for an extension of the overnight pullback from the 1.3500 psychological mark, or over a two-month high.
The US Dollar (USD) is weighed down by Philadelphia Federal Reserve Bank President Patrick Harker’s dovish remarks on Tuesday, saying that they will probably start lowering the policy rate sometime next year. This, in turn, is seen as a key factor capping the upside for the USD/CAD pair, though the prospects for further policy tightening by the Fed should help limit any meaningful downside. In fact, the markets seem convinced that the US central bank will stick to its hawkish stance and keep interest rates higher for longer in the wake of an extremely resilient economy.
It is worth recalling that the closely-watched US monthly jobs report released last Friday pointed to the continued tightness in the labour market and raised the odds for a soft economic landing. Moreover, Fed Governor Michele Bowman kept alive hopes for one more 25 bps lift-off in September or November and said on Monday that additional interest rate hikes will likely be needed to lower inflation to the central bank’s 2% target. This, along with a softer risk tone, supports prospects for the emergence of some buying around the safe-haven buck and should act as a tailwind for the USD/CAD pair.
In contrast, the Bank of Canada (BoC) is now expected to pause its interest rate hike campaign, especially after Statistics Canada reported that the economy shed 6,400 jobs in July and the jobless rate ticked up to 5.5%. Apart from this, a mildly softer tone around Crude Oil prices could undermine the commodity-linked Loonie and lend support to the USD/CAD pair. This, along with a sustained break and acceptance above a technically significant 100-day SMA, suggests that the path of least resistance for spot prices is to the downside and adds credence to the near-term positive outlook.
Technical Levels: Supports and Resistances
USDCAD currently trading at 1.342 at the time of writing. Pair opened at 1.3419 and is trading with a change of 0.01 % .
| Overview | Overview.1 | |
|---|---|---|
| 0 | Today last price | 1.3420 |
| 1 | Today Daily Change | 0.0001 |
| 2 | Today Daily Change % | 0.0100 |
| 3 | Today daily open | 1.3419 |
The pair is trading above its 20 Daily moving average @ 1.324, above its 50 Daily moving average @ 1.3271 , above its 100 Daily moving average @ 1.3396 and below its 200 Daily moving average @ 1.3454
| Trends | Trends.1 | |
|---|---|---|
| 0 | Daily SMA20 | 1.3240 |
| 1 | Daily SMA50 | 1.3271 |
| 2 | Daily SMA100 | 1.3396 |
| 3 | Daily SMA200 | 1.3454 |
The previous day high was 1.3502 while the previous day low was 1.3365. The daily 38.2% Fib levels comes at 1.345, expected to provide resistance. Similarly, the daily 61.8% fib level is at 1.3417, expected to provide resistance.
Note the levels of interest below:
- Pivot support is noted at 1.3355, 1.3292, 1.3218
- Pivot resistance is noted at 1.3492, 1.3566, 1.3629
| Levels | Levels.1 |
|---|---|
| Previous Daily High | 1.3502 |
| Previous Daily Low | 1.3365 |
| Previous Weekly High | 1.3394 |
| Previous Weekly Low | 1.3151 |
| Previous Monthly High | 1.3387 |
| Previous Monthly Low | 1.3093 |
| Daily Fibonacci 38.2% | 1.3450 |
| Daily Fibonacci 61.8% | 1.3417 |
| Daily Pivot Point S1 | 1.3355 |
| Daily Pivot Point S2 | 1.3292 |
| Daily Pivot Point S3 | 1.3218 |
| Daily Pivot Point R1 | 1.3492 |
| Daily Pivot Point R2 | 1.3566 |
| Daily Pivot Point R3 | 1.3629 |
[/s2If]
Download Nehcap EAWe have two EAs that are operational on our LIVE accounts.
- EA-FIX: Check out the details here. Download EA-FIX . EA-FIX is a non-grid HFT scalper.
- EA-GROWTH: High quality low dd EA using trend grids. Download EA_GROWTHJoin Our Telegram Group
")


