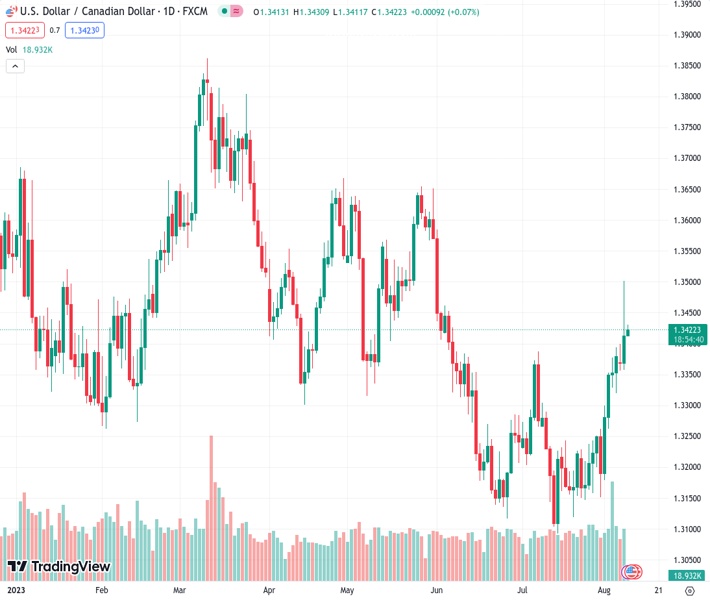
The US dollar to Canadian dollar exchange rate, currently at 1.34221, is gathering strength around 1.3425 due to the market’s increasing wariness.
…
This is a premium post.
[s2If !current_user_can(access_s2member_level4)]Please register for FREE REGISTER to read full post below containing analysis. In case of any error or you think you are not able to read the full post below, please email us at support#nehcap.com [lwa][/s2If] [s2If current_user_can(access_s2member_level1)]
- USD/CAD gains momentum near 1.3425 as the markets turn cautious.
The pair currently trades last at 1.34221.
The previous day high was 1.3502 while the previous day low was 1.3365. The daily 38.2% Fib levels comes at 1.345, expected to provide resistance. Similarly, the daily 61.8% fib level is at 1.3417, expected to provide support.
The USD/CAD pair extends its upside above the 1.3400 mark on the back of a cautious market mood during the early Asian session on Wednesday. The major currently trades around 1.3425, gaining 0.04% for the day.
The US trade data show a sluggish economic rebound and subdued global demand in the country. The US trade deficit narrowed sharply in June, with the figure coming in at $65.5 billion, higher than expectations of $65 billion and below the $68.3 billion prior.
On the same line, Imports fell 1.0% to $313 billion from $316.1 billion the previous month, the lowest level since November 2021. The Commerce Department reported that a drop in Imports on Tuesday might indicate a slowdown in company investment and domestic demand despite the Federal Reserve’s significant interest rate rises. Meanwhile, Exports dropped 0.1% to $247.5 billion, a 15-month low.
Additionally, Moody’s downgraded the credit ratings of several midsize and small US lenders and issued a warning about possible cuts to the ratings of larger institutions. Moody’s added that banks with significant unrealized losses that are not reflected in their regulatory capital ratios are vulnerable to a loss of confidence in the current tightening policy cycle. Markets turn cautious about this headline and lift the safe-haven Dollar.
On the other hand, Loonie has attracted some sellers from the weaker than expected labor data last week. Statistics Canada revealed that the Canadian economy unexpectedly lost 6,400 jobs in July. Meanwhile, the Unemployment rate rose to 5.5%. The data might convince the Bank of Canada (BoC) to maintain its monetary policy this year. and might cap the upside in the Canadian Dollar.
Meanwhile, the uptick in oil prices has supported the Loonie and offset the downbeat Canadian data. Higher crude prices strengthen the Canadian Dollar, as the country is the leading oil exporter to the United States.
Looking ahead, investors will keep an eye on the US inflation data later this week. The US Consumer Price Index (CPI) for July and the Producer Price Index (PPI) will be released on Thursday and Friday, respectively. The data will be critical for determining a clear movement for the USD/CAD pair.
Technical Levels: Supports and Resistances
USDCAD currently trading at 1.3424 at the time of writing. Pair opened at 1.3419 and is trading with a change of 0.04 % .
| Overview | Overview.1 | |
|---|---|---|
| 0 | Today last price | 1.3424 |
| 1 | Today Daily Change | 0.0005 |
| 2 | Today Daily Change % | 0.0400 |
| 3 | Today daily open | 1.3419 |
The pair is trading above its 20 Daily moving average @ 1.324, above its 50 Daily moving average @ 1.3271 , above its 100 Daily moving average @ 1.3396 and below its 200 Daily moving average @ 1.3454
| Trends | Trends.1 | |
|---|---|---|
| 0 | Daily SMA20 | 1.3240 |
| 1 | Daily SMA50 | 1.3271 |
| 2 | Daily SMA100 | 1.3396 |
| 3 | Daily SMA200 | 1.3454 |
The previous day high was 1.3502 while the previous day low was 1.3365. The daily 38.2% Fib levels comes at 1.345, expected to provide resistance. Similarly, the daily 61.8% fib level is at 1.3417, expected to provide support.
Note the levels of interest below:
- Pivot support is noted at 1.3355, 1.3292, 1.3218
- Pivot resistance is noted at 1.3492, 1.3566, 1.3629
| Levels | Levels.1 |
|---|---|
| Previous Daily High | 1.3502 |
| Previous Daily Low | 1.3365 |
| Previous Weekly High | 1.3394 |
| Previous Weekly Low | 1.3151 |
| Previous Monthly High | 1.3387 |
| Previous Monthly Low | 1.3093 |
| Daily Fibonacci 38.2% | 1.3450 |
| Daily Fibonacci 61.8% | 1.3417 |
| Daily Pivot Point S1 | 1.3355 |
| Daily Pivot Point S2 | 1.3292 |
| Daily Pivot Point S3 | 1.3218 |
| Daily Pivot Point R1 | 1.3492 |
| Daily Pivot Point R2 | 1.3566 |
| Daily Pivot Point R3 | 1.3629 |
[/s2If]
Download Nehcap EAWe have two EAs that are operational on our LIVE accounts.
- EA-FIX: Check out the details here. Download EA-FIX . EA-FIX is a non-grid HFT scalper.
- EA-GROWTH: High quality low dd EA using trend grids. Download EA_GROWTHJoin Our Telegram Group
")


