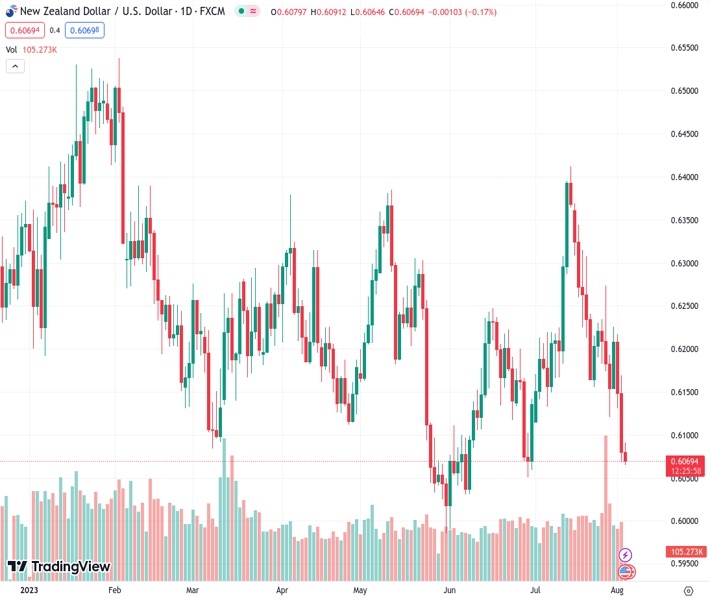
The NZDUSD pair continues to stay low for the third consecutive day, reaching a new low for several weeks.
…
This is a premium post.
[s2If !current_user_can(access_s2member_level4)]Please register for FREE REGISTER to read full post below containing analysis. In case of any error or you think you are not able to read the full post below, please email us at support#nehcap.com [lwa][/s2If] [s2If current_user_can(access_s2member_level1)]
- NZD/USD remains depressed for the third straight day and hits a fresh multi-week low.
The pair currently trades last at 0.60716.
The previous day high was 0.6173 while the previous day low was 0.6068. The daily 38.2% Fib levels comes at 0.6108, expected to provide resistance. Similarly, the daily 61.8% fib level is at 0.6133, expected to provide resistance.
The NZD/USD pair edges lower for the third successive day – also marking the sixth day of a negative move in the previous seven – and drops to its lowest level since late June on Thursday. Spot prices remain on the defensive, around the 0.6070-0.6065 region through the early part of the European session and seem vulnerable to extending a three-week-old descending trend.
Against the backdrop of this week’s failure near a technically significant 200-day Simple Moving Average (SMA), the overnight breakdown through the 0.6145-0.6140 confluence support was seen as a fresh trigger for bearish traders. The said area comprises the 61.8% Fibonacci retracement level of the May-July rally and an ascending trend-line extending from the YTD trough. This should now act as a pivotal point and cap any attempted recovery for the NZD/USD pair.
Meanwhile, technical indicators on the daily chart are holding deep in the negative territory and are still far from being in the oversold territory, adding credence to the bearish outlook for the NZD/USD pair. Some follow-through selling below the 0.6050 area (June 29 low) will reaffirm the negative bias and make spot prices vulnerable to accelerate the downward trajectory towards the 0.6000 psychological mark en route to the YTD low, around the 0.5985 region touched in May.
On the flip side, the 0.6100 round figure now seems to act as an immediate barrier ahead of the 0.6140-0.6145 confluence support breakpoint, now turned resistance. A sustained strength beyond might trigger a short-covering rally and allow the NZD/USD pair to aim back to reclaim the 0.6200 mark, which coincides with the 50% Fibo. level. This is closely followed by the 200-day SMA, around the 0.6220-0.6225 region, which if cleared could negate the negative outlook.
Technical Levels: Supports and Resistances
NZDUSD currently trading at 0.6073 at the time of writing. Pair opened at 0.608 and is trading with a change of -0.12 % .
| Overview | Overview.1 | |
|---|---|---|
| 0 | Today last price | 0.6073 |
| 1 | Today Daily Change | -0.0007 |
| 2 | Today Daily Change % | -0.1200 |
| 3 | Today daily open | 0.6080 |
The pair remains strongly bearish on the daily time frame. It trades below the 20 SMA @ 0.6225, 50 SMA 0.6164, 100 SMA @ 0.6196 and 200 SMA @ 0.6225.
| Trends | Trends.1 | |
|---|---|---|
| 0 | Daily SMA20 | 0.6225 |
| 1 | Daily SMA50 | 0.6164 |
| 2 | Daily SMA100 | 0.6196 |
| 3 | Daily SMA200 | 0.6225 |
The previous day high was 0.6173 while the previous day low was 0.6068. The daily 38.2% Fib levels comes at 0.6108, expected to provide resistance. Similarly, the daily 61.8% fib level is at 0.6133, expected to provide resistance.
Note the levels of interest below:
- Pivot support is noted at 0.6041, 0.6002, 0.5936
- Pivot resistance is noted at 0.6146, 0.6212, 0.6252
| Levels | Levels.1 |
|---|---|
| Previous Daily High | 0.6173 |
| Previous Daily Low | 0.6068 |
| Previous Weekly High | 0.6274 |
| Previous Weekly Low | 0.6120 |
| Previous Monthly High | 0.6413 |
| Previous Monthly Low | 0.6120 |
| Daily Fibonacci 38.2% | 0.6108 |
| Daily Fibonacci 61.8% | 0.6133 |
| Daily Pivot Point S1 | 0.6041 |
| Daily Pivot Point S2 | 0.6002 |
| Daily Pivot Point S3 | 0.5936 |
| Daily Pivot Point R1 | 0.6146 |
| Daily Pivot Point R2 | 0.6212 |
| Daily Pivot Point R3 | 0.6252 |
[/s2If]
Download Nehcap EAWe have two EAs that are operational on our LIVE accounts.
- EA-FIX: Check out the details here. Download EA-FIX . EA-FIX is a non-grid HFT scalper.
- EA-GROWTH: High quality low dd EA using trend grids. Download EA_GROWTHJoin Our Telegram Group
")


