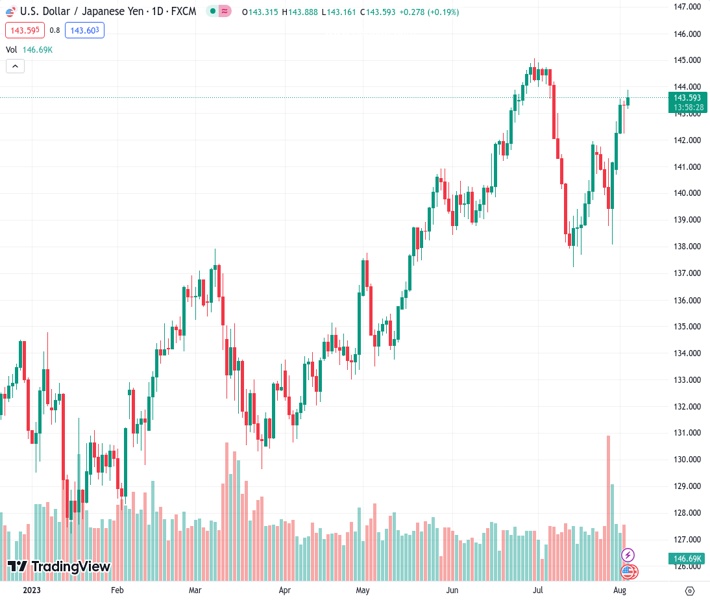
The exchange rate for USDJPY has increased in strength and is now approaching the 143.65 level.
…
This is a premium post.
[s2If !current_user_can(access_s2member_level4)]Please register for FREE REGISTER to read full post below containing analysis. In case of any error or you think you are not able to read the full post below, please email us at support#nehcap.com [lwa][/s2If] [s2If current_user_can(access_s2member_level1)]
- USD/JPY gains momentum and edges higher to the 143.65 mark.
The pair currently trades last at 143.675.
The previous day high was 143.48 while the previous day low was 142.23. The daily 38.2% Fib levels comes at 143.0, expected to provide support. Similarly, the daily 61.8% fib level is at 142.71, expected to provide support.
The USD/JPY pair extends its upside heading into the early European session on Thursday. Bank of Japan (BoJ) Governor Kazuo Ueda indicated that the tolerance band for the benchmark 10-year Japanese Government Bonds (JGB) will widen from 0.5% to 1.0%. The move pushed JGB yields to their highest level since 2014. The 10-year JGB rose to 0.65% on Thursday. The major pair currently trades around 143.65, up to 0.24% for the day.
According to the four-hour chart, the USD/JPY pair stands above the 50- and 100-hour Exponential Moving Averages (EMAs) with an upward slope, which means the path of least resistance is to the upside for the time being.
Any meaningful follow-through buying beyond 143.80 (the upper boundary of the Bollinger Band) could pave the way to the next hurdle at 144.65 (High of July 6). Further north, the 145.00 area appears to be a tough nut to crack for USD/JPY. The mentioned level is a confluence of a psychological round mark and a year-to-date high (YTD).
On the other hand, the first support stop for USD/JPY is located at 142.80 (midline of the Bollinger Band). The additional downside filter to watch is 141.78, highlighting the 50-hour EMA and the lower limit of the Bollinger Band. A decisive break below the latter would see a drop to 141.35 (100-hour EMA) and 141.00 (a psychological round figure).
It’s worth noting that the Relative Strength Index (RSI) stands above 50, and the MACD holds in bullish territory, which indicates that the upside momentum has been activated.
Technical Levels: Supports and Resistances
USDJPY currently trading at 143.62 at the time of writing. Pair opened at 143.33 and is trading with a change of 0.2 % .
| Overview | Overview.1 | |
|---|---|---|
| 0 | Today last price | 143.62 |
| 1 | Today Daily Change | 0.29 |
| 2 | Today Daily Change % | 0.20 |
| 3 | Today daily open | 143.33 |
The pair remains strongly bullish on the daily timeframe. It trades above its 20 SMA @ 140.73, 50 SMA 141.21, 100 SMA @ 137.7 and 200 SMA @ 136.63.
| Trends | Trends.1 | |
|---|---|---|
| 0 | Daily SMA20 | 140.73 |
| 1 | Daily SMA50 | 141.21 |
| 2 | Daily SMA100 | 137.70 |
| 3 | Daily SMA200 | 136.63 |
The previous day high was 143.48 while the previous day low was 142.23. The daily 38.2% Fib levels comes at 143.0, expected to provide support. Similarly, the daily 61.8% fib level is at 142.71, expected to provide support.
Note the levels of interest below:
- Pivot support is noted at 142.55, 141.76, 141.3
- Pivot resistance is noted at 143.8, 144.26, 145.05
| Levels | Levels.1 |
|---|---|
| Previous Daily High | 143.48 |
| Previous Daily Low | 142.23 |
| Previous Weekly High | 141.82 |
| Previous Weekly Low | 138.07 |
| Previous Monthly High | 144.91 |
| Previous Monthly Low | 137.24 |
| Daily Fibonacci 38.2% | 143.00 |
| Daily Fibonacci 61.8% | 142.71 |
| Daily Pivot Point S1 | 142.55 |
| Daily Pivot Point S2 | 141.76 |
| Daily Pivot Point S3 | 141.30 |
| Daily Pivot Point R1 | 143.80 |
| Daily Pivot Point R2 | 144.26 |
| Daily Pivot Point R3 | 145.05 |
[/s2If]
Download Nehcap EAWe have two EAs that are operational on our LIVE accounts.
- EA-FIX: Check out the details here. Download EA-FIX . EA-FIX is a non-grid HFT scalper.
- EA-GROWTH: High quality low dd EA using trend grids. Download EA_GROWTHJoin Our Telegram Group
")


