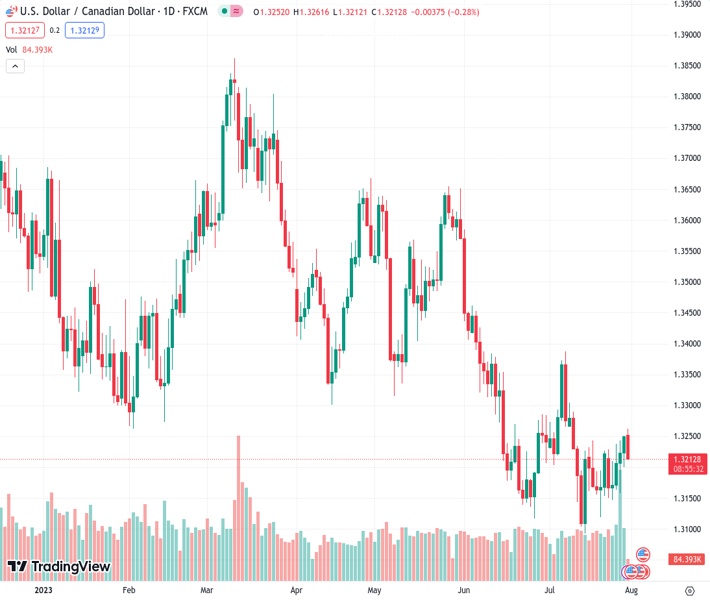
There is a level of support around 1.3200 for the USDCAD currency pair, as the US Dollar is experiencing a correction and oil prices are increasing.
…
This is a premium post.
[s2If !current_user_can(access_s2member_level4)]Please register for FREE REGISTER to read full post below containing analysis. In case of any error or you think you are not able to read the full post below, please email us at support#nehcap.com [lwa][/s2If] [s2If current_user_can(access_s2member_level1)]
- USD/CAD sees support near 1.3200 amid US Dollar’s correction and rising oil prices.
The pair currently trades last at 1.32153.
The previous day high was 1.3255 while the previous day low was 1.3201. The daily 38.2% Fib levels comes at 1.3234, expected to provide resistance. Similarly, the daily 61.8% fib level is at 1.3222, expected to provide resistance.
The USD/CAD pair witnesses selling pressure after failing to sustain above the crucial resistance of 1.3250 in the London session. The Loonie asset attracts offers as the US Dollar Index (DXY) extends correction to near 101.60.
S&P500 futures generate some gains in Europe, portraying an upbeat market mood. US equities were heavily bought on Friday, supported by a rally in technology stocks. The USD Index faces a sell-off amid uncertainty ahead of the United States Manufacturing PMI, which will be announced on Tuesday at 14:00 GMT.
As per the preliminary report, US factory activities landed at 46.5 in July, higher than June’s release of 46.0. In spite of a higher figure, the economic data remained in a contraction phase. A figure below 50.0 is considered a contraction in economic activities. It is worth noting that US factory activities have been consistently contracting for the past eight months due to higher interest rates and tight credit conditions by US regional banks.
Apart from the Manufacturing PMI, investors will focus on forward orders report. The economic data is seen declining to 44.0 vs. the prior release of 45.6. The underperformance of the US Manufacturing PMI would allow the Fed to keep interest rates steady in September monetary policy. Meanwhile, the 10-year US Treasury yields seem sluggish around 3.96%.
On the Canadian Dollar front, investors await labor market data, which will release later this week. According to the estimates, the Canadian economy added 20.6K fresh payrolls in July, lower than the additions of 59.9K recorded in June. The Unemployment Rate is seen rising to 5.5% vs. the former release of 5.4%.
Meanwhile, oil prices soar above $81.00 as investors are seeing global interest rates peaking now. Investors should note that Canada is the leading exporter of oil to the United States and higher oil prices support the Canadian Dollar.
Technical Levels: Supports and Resistances
USDCAD currently trading at 1.3217 at the time of writing. Pair opened at 1.3254 and is trading with a change of -0.28 % .
| Overview | Overview.1 | |
|---|---|---|
| 0 | Today last price | 1.3217 |
| 1 | Today Daily Change | -0.0037 |
| 2 | Today Daily Change % | -0.2800 |
| 3 | Today daily open | 1.3254 |
The pair remains strongly bearish on the daily time frame. It trades below the 20 SMA @ 1.3219, 50 SMA 1.3305, 100 SMA @ 1.3423 and 200 SMA @ 1.3463.
| Trends | Trends.1 | |
|---|---|---|
| 0 | Daily SMA20 | 1.3219 |
| 1 | Daily SMA50 | 1.3305 |
| 2 | Daily SMA100 | 1.3423 |
| 3 | Daily SMA200 | 1.3463 |
The previous day high was 1.3255 while the previous day low was 1.3201. The daily 38.2% Fib levels comes at 1.3234, expected to provide resistance. Similarly, the daily 61.8% fib level is at 1.3222, expected to provide resistance.
Note the levels of interest below:
- Pivot support is noted at 1.3218, 1.3183, 1.3165
- Pivot resistance is noted at 1.3272, 1.329, 1.3326
| Levels | Levels.1 |
|---|---|
| Previous Daily High | 1.3255 |
| Previous Daily Low | 1.3201 |
| Previous Weekly High | 1.3255 |
| Previous Weekly Low | 1.3147 |
| Previous Monthly High | 1.3585 |
| Previous Monthly Low | 1.3117 |
| Daily Fibonacci 38.2% | 1.3234 |
| Daily Fibonacci 61.8% | 1.3222 |
| Daily Pivot Point S1 | 1.3218 |
| Daily Pivot Point S2 | 1.3183 |
| Daily Pivot Point S3 | 1.3165 |
| Daily Pivot Point R1 | 1.3272 |
| Daily Pivot Point R2 | 1.3290 |
| Daily Pivot Point R3 | 1.3326 |
[/s2If]
Download Nehcap EAWe have two EAs that are operational on our LIVE accounts.
- EA-FIX: Check out the details here. Download EA-FIX . EA-FIX is a non-grid HFT scalper.
- EA-GROWTH: High quality low dd EA using trend grids. Download EA_GROWTHJoin Our Telegram Group
")


