The BOJ meeting, which lasted for two days, ended with a surprising modification to the Yield Curve Control. The EURJPY is currently at 155.450.
…
This is a premium post.
[s2If !current_user_can(access_s2member_level4)]Please register for FREE REGISTER to read full post below containing analysis. In case of any error or you think you are not able to read the full post below, please email us at support#nehcap.com [lwa][/s2If] [s2If current_user_can(access_s2member_level1)]
- The two-day BOJ meeting concluded with an unexpected adjustment to the Yield Curve Control.
The pair currently trades last at 155.450.
The previous day high was 156.24 while the previous day low was 152.19. The daily 38.2% Fib levels comes at 153.74, expected to provide support. Similarly, the daily 61.8% fib level is at 154.69, expected to provide support.
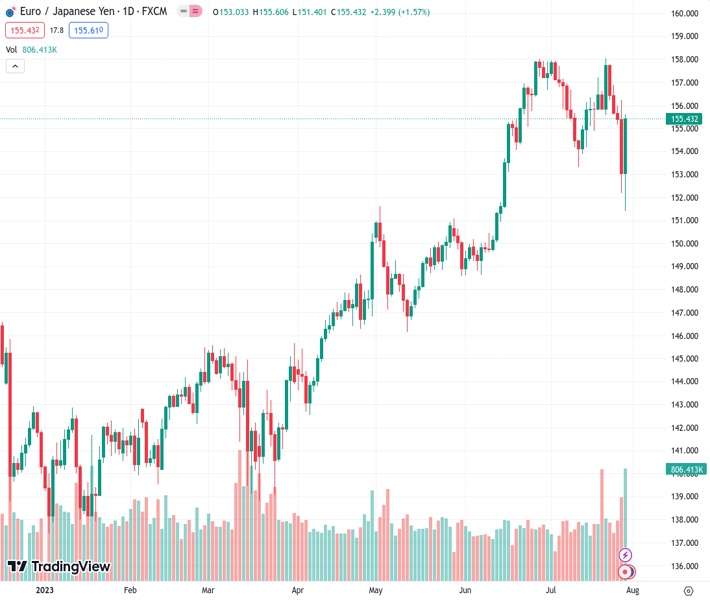
At the time of writing, the EUR/JPY pair is trading near the 155.50 area, marking a significant 1.54% increase from its opening price. The pair experienced a daily low of 151.40, and then the Yen lost interest as investors took the Bank of Japan decision as dovish.
On the one hand, Thursday’s rumours materialised, and the two-day BoJ meeting concluded with an unexpected adjustment to the Yield Curve Control (YCC) and the offer to buy 10-year JGBs at 1.0% every day, leading to market volatility. The 2-year yield rose to -0.012%, while the 5 and 10-year yields reached 0.162% and 0.567%, respectively. However, the BoJ interest rate decision remained unchanged. Still, Governor Ueda commented that the YCC tweak wasn’t a step to normalisation and that the bank, nowhere near raising rates, is weakening the Yen.
On the other hand, Germany reported encouraging economic data. The Harmonized Index of Consumer Prices (HICP) (YoY) for July aligned with expectations of 6.5%, a bit lower than the previous 6.4%. In addition, the Gross Domestic Product (YoY) for Q2 decreased but was lower than expected at 0.2% vs the projections of 0.3%.
On Thursday, Christine Lagarde commented that monetary policy decisions would be based on incoming data, so soft inflation figures make markets bet on a dovish European Central Bank (ECB). In that sense, the 2, 5 and 10-year German yields are decreasing by more than 0.50%.
The daily candlestick chart shows that the EUR/JPY trades bullish, ending the week. The Relative Strength Index (RSI) is just slightly above the midline, with a steep positive slope of 90 degrees. The Moving Average Convergence Divergence (MACD) prints fading soft red bars indicating that bulls are quickly gaining ground. On the bigger picture, the pair trades above the 20-day Simple Moving Average (SMA), reinforcing a bullish momentum.
Resistance levels: 155.84 (20-day SMA), 156.00, 156.50.
Support levels: 155.00, 153.00,151.50.
Technical Levels: Supports and Resistances
EURJPY currently trading at 155.51 at the time of writing. Pair opened at 153.08 and is trading with a change of 1.59 % .
| Overview | Overview.1 | |
|---|---|---|
| 0 | Today last price | 155.51 |
| 1 | Today Daily Change | 2.43 |
| 2 | Today Daily Change % | 1.59 |
| 3 | Today daily open | 153.08 |
The pair is trading below its 20 Daily moving average @ 155.99, above its 50 Daily moving average @ 153.72 , above its 100 Daily moving average @ 149.73 and above its 200 Daily moving average @ 146.43
| Trends | Trends.1 | |
|---|---|---|
| 0 | Daily SMA20 | 155.99 |
| 1 | Daily SMA50 | 153.72 |
| 2 | Daily SMA100 | 149.73 |
| 3 | Daily SMA200 | 146.43 |
The previous day high was 156.24 while the previous day low was 152.19. The daily 38.2% Fib levels comes at 153.74, expected to provide support. Similarly, the daily 61.8% fib level is at 154.69, expected to provide support.
Note the levels of interest below:
- Pivot support is noted at 151.44, 149.79, 147.39
- Pivot resistance is noted at 155.48, 157.88, 159.53
| Levels | Levels.1 |
|---|---|
| Previous Daily High | 156.24 |
| Previous Daily Low | 152.19 |
| Previous Weekly High | 158.05 |
| Previous Weekly Low | 154.88 |
| Previous Monthly High | 158.00 |
| Previous Monthly Low | 148.62 |
| Daily Fibonacci 38.2% | 153.74 |
| Daily Fibonacci 61.8% | 154.69 |
| Daily Pivot Point S1 | 151.44 |
| Daily Pivot Point S2 | 149.79 |
| Daily Pivot Point S3 | 147.39 |
| Daily Pivot Point R1 | 155.48 |
| Daily Pivot Point R2 | 157.88 |
| Daily Pivot Point R3 | 159.53 |
[/s2If]
Download Nehcap EAWe have two EAs that are operational on our LIVE accounts.
- EA-FIX: Check out the details here. Download EA-FIX . EA-FIX is a non-grid HFT scalper.
- EA-GROWTH: High quality low dd EA using trend grids. Download EA_GROWTHJoin Our Telegram Group
")


