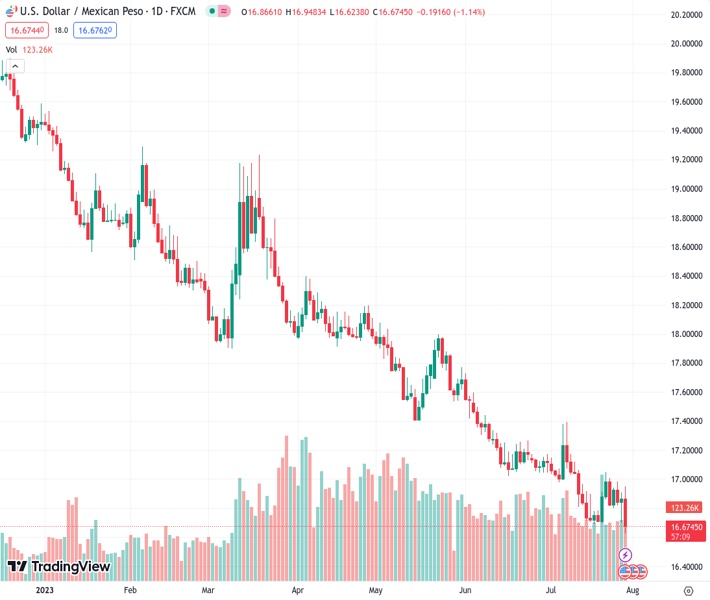
The US Dollar-Mexican Peso exchange rate hit a new low of 16.62 on Friday and is likely to end the week with a loss of 1.70%.
…
This is a premium post.
[s2If !current_user_can(access_s2member_level4)]Please register for FREE REGISTER to read full post below containing analysis. In case of any error or you think you are not able to read the full post below, please email us at support#nehcap.com [lwa][/s2If] [s2If current_user_can(access_s2member_level1)]
- USD/MXN printed a fresh cycle low on Friday of 16.62 and is poised to close a 1.70% weekly loss.
The pair currently trades last at 16.6747.
The previous day high was 16.9084 while the previous day low was 16.7037. The daily 38.2% Fib levels comes at 16.8302, expected to provide resistance. Similarly, the daily 61.8% fib level is at 16.7819, expected to provide resistance.
On Friday, the USD/MXN pair fell to its lowest point since December 2015, this time weakened but soft Core Personal Consumption Expenditures (PCE) figure from June.
In that sense, the figures, which act as an essential gauge of inflation for the Federal Reserve (Fed), dropped to 4.1% YoY in June, lower than the 4.2% expected and the previous 4.6%. Its worth noticing that regarding September’s meeting, Jerome Powell added that the Fed can pause or hike and will depend solely on the data, so soft inflation figures make a case for a pause stronger, making the US yields decrease across the board.
However, the economic outlook from the US is strong as on Thursday, positive Q2 Gross Domestic Product (GDP) was reported, along with robust Durable Goods and Jobless Claims data. That being said, the next two set of inflation and job report figures before the Federal Open Market Committee (FOMC) meeting will be the ones which model the tightening expectations.
The daily and weekly charts show that the technical outlook is bearish. On the daily chart, the Relative Strength Index (RSI) and the Moving Average Convergence Divergence (MACD) hint at the bears holding strong momentum while the pair trades below the 20,100 and 200-day Simple Moving Averages (SMA).
Support levels: 16.60, 16.50, 16.30.
Resistance levels: 16.90 (20-day SMA), 17.00, 17.20.
Technical Levels: Supports and Resistances
USDMXN currently trading at 16.6785 at the time of writing. Pair opened at 16.8724 and is trading with a change of -1.15 % .
| Overview | Overview.1 | |
|---|---|---|
| 0 | Today last price | 16.6785 |
| 1 | Today Daily Change | -0.1939 |
| 2 | Today Daily Change % | -1.1500 |
| 3 | Today daily open | 16.8724 |
The pair remains strongly bearish on the daily time frame. It trades below the 20 SMA @ 16.9381, 50 SMA 17.2133, 100 SMA @ 17.6686 and 200 SMA @ 18.403.
| Trends | Trends.1 | |
|---|---|---|
| 0 | Daily SMA20 | 16.9381 |
| 1 | Daily SMA50 | 17.2133 |
| 2 | Daily SMA100 | 17.6686 |
| 3 | Daily SMA200 | 18.4030 |
The previous day high was 16.9084 while the previous day low was 16.7037. The daily 38.2% Fib levels comes at 16.8302, expected to provide resistance. Similarly, the daily 61.8% fib level is at 16.7819, expected to provide resistance.
Note the levels of interest below:
- Pivot support is noted at 16.748, 16.6235, 16.5433
- Pivot resistance is noted at 16.9527, 17.0329, 17.1573
| Levels | Levels.1 |
|---|---|
| Previous Daily High | 16.9084 |
| Previous Daily Low | 16.7037 |
| Previous Weekly High | 17.0512 |
| Previous Weekly Low | 16.6924 |
| Previous Monthly High | 17.7286 |
| Previous Monthly Low | 17.0243 |
| Daily Fibonacci 38.2% | 16.8302 |
| Daily Fibonacci 61.8% | 16.7819 |
| Daily Pivot Point S1 | 16.7480 |
| Daily Pivot Point S2 | 16.6235 |
| Daily Pivot Point S3 | 16.5433 |
| Daily Pivot Point R1 | 16.9527 |
| Daily Pivot Point R2 | 17.0329 |
| Daily Pivot Point R3 | 17.1573 |
[/s2If]
Download Nehcap EAWe have two EAs that are operational on our LIVE accounts.
- EA-FIX: Check out the details here. Download EA-FIX . EA-FIX is a non-grid HFT scalper.
- EA-GROWTH: High quality low dd EA using trend grids. Download EA_GROWTHJoin Our Telegram Group
")


