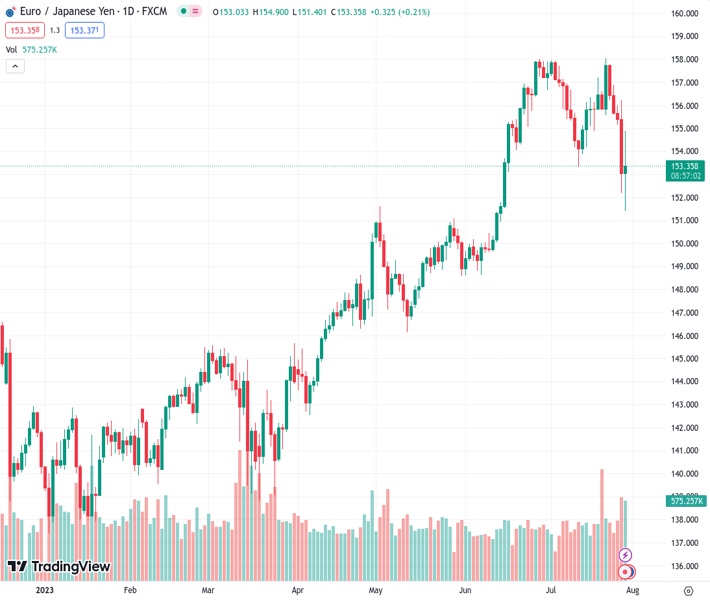
There is a significant fluctuation in the trading pattern of EURJPY, currently at 153.325, following its initial decline to 151.40.
…
This is a premium post.
[s2If !current_user_can(access_s2member_level4)]Please register for FREE REGISTER to read full post below containing analysis. In case of any error or you think you are not able to read the full post below, please email us at support#nehcap.com [lwa][/s2If] [s2If current_user_can(access_s2member_level1)]
- EUR/JPY trades in a volatile fashion after the initial drop to 151.40.
The pair currently trades last at 153.325.
The previous day high was 156.24 while the previous day low was 152.19. The daily 38.2% Fib levels comes at 153.74, expected to provide resistance. Similarly, the daily 61.8% fib level is at 154.69, expected to provide resistance.
EUR/JPY trades in quite a volatile fashion following both the ECB and the BoJ meetings.
Once the dust settles, further decline could prompt the cross to test the interim 100-day SMA around 149.80. On the other hand, the resumption of the uptrend could motivate the cross to dispute the 2023 high in the 158.00 zone.
So far, the longer term positive outlook for the cross appears favoured while above the 200-day SMA, today at 146.43.
Technical Levels: Supports and Resistances
EURJPY currently trading at 153.12 at the time of writing. Pair opened at 153.08 and is trading with a change of 0.03 % .
| Overview | Overview.1 | |
|---|---|---|
| 0 | Today last price | 153.12 |
| 1 | Today Daily Change | 350.00 |
| 2 | Today Daily Change % | 0.03 |
| 3 | Today daily open | 153.08 |
The pair is trading below its 20 Daily moving average @ 155.99, below its 50 Daily moving average @ 153.72 , above its 100 Daily moving average @ 149.73 and above its 200 Daily moving average @ 146.43
| Trends | Trends.1 | |
|---|---|---|
| 0 | Daily SMA20 | 155.99 |
| 1 | Daily SMA50 | 153.72 |
| 2 | Daily SMA100 | 149.73 |
| 3 | Daily SMA200 | 146.43 |
The previous day high was 156.24 while the previous day low was 152.19. The daily 38.2% Fib levels comes at 153.74, expected to provide resistance. Similarly, the daily 61.8% fib level is at 154.69, expected to provide resistance.
Note the levels of interest below:
- Pivot support is noted at 151.44, 149.79, 147.39
- Pivot resistance is noted at 155.48, 157.88, 159.53
| Levels | Levels.1 |
|---|---|
| Previous Daily High | 156.24 |
| Previous Daily Low | 152.19 |
| Previous Weekly High | 158.05 |
| Previous Weekly Low | 154.88 |
| Previous Monthly High | 158.00 |
| Previous Monthly Low | 148.62 |
| Daily Fibonacci 38.2% | 153.74 |
| Daily Fibonacci 61.8% | 154.69 |
| Daily Pivot Point S1 | 151.44 |
| Daily Pivot Point S2 | 149.79 |
| Daily Pivot Point S3 | 147.39 |
| Daily Pivot Point R1 | 155.48 |
| Daily Pivot Point R2 | 157.88 |
| Daily Pivot Point R3 | 159.53 |
[/s2If]
Download Nehcap EAWe have two EAs that are operational on our LIVE accounts.
- EA-FIX: Check out the details here. Download EA-FIX . EA-FIX is a non-grid HFT scalper.
- EA-GROWTH: High quality low dd EA using trend grids. Download EA_GROWTHJoin Our Telegram Group
")


