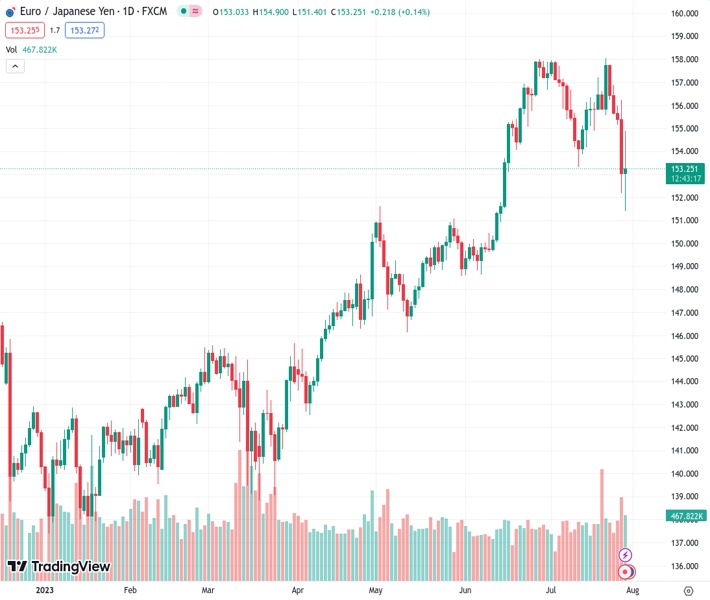
On Friday, there were significant price fluctuations for the EURJPY currency pair at a rate of 153.352 following the important decision made by the Bank of Japan (BoJ).
…
This is a premium post.
[s2If !current_user_can(access_s2member_level4)]Please register for FREE REGISTER to read full post below containing analysis. In case of any error or you think you are not able to read the full post below, please email us at support#nehcap.com [lwa][/s2If] [s2If current_user_can(access_s2member_level1)]
- EUR/JPY witnessed good two-way price swings on Friday after the crucial BoJ decision.
The pair currently trades last at 153.352.
The previous day high was 156.24 while the previous day low was 152.19. The daily 38.2% Fib levels comes at 153.74, expected to provide resistance. Similarly, the daily 61.8% fib level is at 154.69, expected to provide resistance.
The EUR/JPY cross fades an intraday bullish spike to the 155.00 neighbourhood and plummets to its lowest level since mid-June in the aftermath of a somewhat hawkish message from the Bank of Japan (BoJ) on Friday. Spot prices, however, manage to recover a major part of the intraday losses and trade just above the 153.00 mark, nearly unchanged for the day during the early European session.
The BoJ took steps to make its Yield Curve Control (YCC) policy more flexible and said that the 0.5% cap on the 10-year Japanese government bond yield will now be “references” rather than “rigid limits”. The Japanese central bank added that it would now step into the markets at a yield of 1.0%, which was seen as a move towards an eventual shift away from the massive monetary stimulus. This, in turn, pushes the 10-year JGB yield to its highest level since September 2014 and provides a strong boost to the JPY, prompting aggressive intraday selling around the EUR/JPY cross.
Spot prices tumble around 350 pips intraday, albeit manage to find decent support near the 151.40 area after the BoJ Governor Kazuo Ueda, speaking at the post-meeting press conference, reiterated the need to maintain monetary support. Ueda added that the central bank won’t hesitate to ease policy further as needed and that more time was needed to sustainably achieve the 2% inflation target. This, along with a positive tone around the US equity futures, undermines the safe-haven JPY and assists the EUR/JPY cross to attract some buying at lower levels.
Any meaningful recovery, however, still seems elusive as bulls remain wary of placing fresh bets around the shared currency in the wake of mixed signals regarding the European Central Bank’s (ECB) next policy move. In fact, the ECB did not provide any explicit forward guidance on Thursday, raising the possibility of a potential pause in September. Furthermore, ECB policymaker Madis Muller noted on Friday that the rate-hike decisions are no longer obvious at the current level. Separately, ECB’s Boštjan Vasle said that the September meeting could bring a hike or a pause.
Apart from this, the worsening economic downturn in the Euro Zone, fueled by the disappointing PMI prints for July, might continue to undermine the Euro and keep a lid on the EUR/JPY cross, at least for the time being. Hence, it will be prudent to wait for strong follow-through buying before confirming that the recent sharp corrective decline from the 158.00 mark, or the highest level since September 2008 has run its course.
Technical Levels: Supports and Resistances
EURJPY currently trading at 153.07 at the time of writing. Pair opened at 153.08 and is trading with a change of -0.01 % .
| Overview | Overview.1 | |
|---|---|---|
| 0 | Today last price | 153.07 |
| 1 | Today Daily Change | -0.01 |
| 2 | Today Daily Change % | -0.01 |
| 3 | Today daily open | 153.08 |
The pair is trading below its 20 Daily moving average @ 155.99, below its 50 Daily moving average @ 153.72 , above its 100 Daily moving average @ 149.73 and above its 200 Daily moving average @ 146.43
| Trends | Trends.1 | |
|---|---|---|
| 0 | Daily SMA20 | 155.99 |
| 1 | Daily SMA50 | 153.72 |
| 2 | Daily SMA100 | 149.73 |
| 3 | Daily SMA200 | 146.43 |
The previous day high was 156.24 while the previous day low was 152.19. The daily 38.2% Fib levels comes at 153.74, expected to provide resistance. Similarly, the daily 61.8% fib level is at 154.69, expected to provide resistance.
Note the levels of interest below:
- Pivot support is noted at 151.44, 149.79, 147.39
- Pivot resistance is noted at 155.48, 157.88, 159.53
| Levels | Levels.1 |
|---|---|
| Previous Daily High | 156.24 |
| Previous Daily Low | 152.19 |
| Previous Weekly High | 158.05 |
| Previous Weekly Low | 154.88 |
| Previous Monthly High | 158.00 |
| Previous Monthly Low | 148.62 |
| Daily Fibonacci 38.2% | 153.74 |
| Daily Fibonacci 61.8% | 154.69 |
| Daily Pivot Point S1 | 151.44 |
| Daily Pivot Point S2 | 149.79 |
| Daily Pivot Point S3 | 147.39 |
| Daily Pivot Point R1 | 155.48 |
| Daily Pivot Point R2 | 157.88 |
| Daily Pivot Point R3 | 159.53 |
[/s2If]
Download Nehcap EAWe have two EAs that are operational on our LIVE accounts.
- EA-FIX: Check out the details here. Download EA-FIX . EA-FIX is a non-grid HFT scalper.
- EA-GROWTH: High quality low dd EA using trend grids. Download EA_GROWTHJoin Our Telegram Group
")


