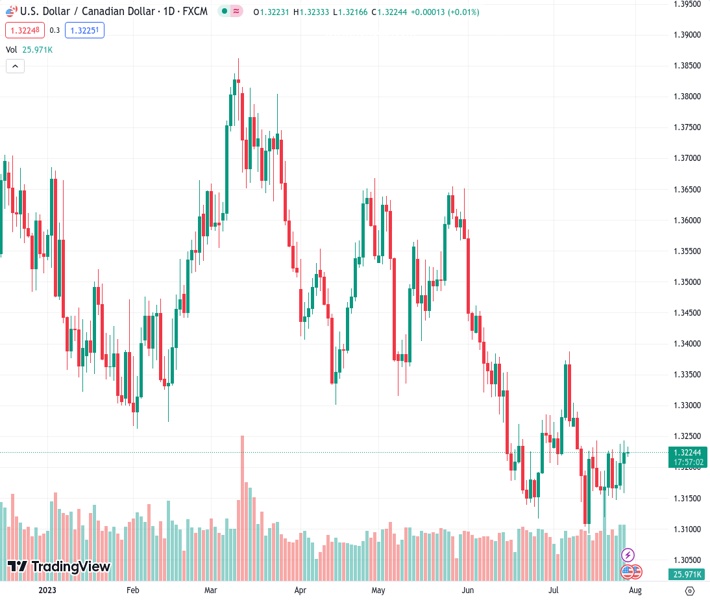
Even though the USDCAD currency pair has not shown any significant activity and has remained relatively stable, it continues to hold onto slight gains. This is surprising considering it has not made any significant moves in the last four days, despite nearing its highest point for the week.
…
This is a premium post.
[s2If !current_user_can(access_s2member_level4)]Please register for FREE REGISTER to read full post below containing analysis. In case of any error or you think you are not able to read the full post below, please email us at support#nehcap.com [lwa][/s2If] [s2If current_user_can(access_s2member_level1)]
- USD/CAD clings to mild gains despite positing inaction during four-day winning streak near weekly high.
The pair currently trades last at 1.32248.
The previous day high was 1.3243 while the previous day low was 1.3158. The daily 38.2% Fib levels comes at 1.3211, expected to provide support. Similarly, the daily 61.8% fib level is at 1.3191, expected to provide support.
USD/CAD remains sidelined near 1.3230, mildly bid during a four-day uptrend amid early Friday. In doing so, the Loonie pair defends the previous day’s run-up at the weekly top even as the market turns cautious ahead of the top-tier US data, as well as due to the mixed sentiment about the US-China ties. It’s worth noting that a pullback in the WTI crude oil prices from a multi-day high also prods the Loonie pair as Canada relies heavily on energy exports for earnings.
Market sentiment remains mildly positive of late and prods the US Dollar bulls by the press time despite fears of fresh US-China tension due to the White House’s readiness to stop the Hong Kong Leader from attending November’s Asia-Pacific Economic Cooperation (APEC) leaders’ summit in San Francisco.
Even so, WTI crude oil retreats from the highest levels since April 19, down 0.20% intraday near $79.50 as the markets await Fed’s favorite inflation gauge, namely the Core Personal Consumption Expenditure (PCE) Price Index for June, expected 4.2% YoY versus 4.6% prior. It’s worth noting that the risk-on mood superseded the US Dollar’s rally to propel the Oil price the previous day.
On the other hand, US Dollar Index (DXY) posted the biggest daily jump since March 15 the previous day, not to forget mentioning a stellar rebound from the weekly low, as the US statistics recall the Fed hawks and bolstered the Treasury bond yields. It’s worth noting that the Wall Street benchmarks closed with nearly half a percent of daily losses whereas the benchmark US 10-year Treasury bond yields marked the biggest daily jump in a month to refresh a three-week high near 4.02%, close to 4.0% by the press time.
Talking about the US data, the preliminary readings of the US Gross Domestic Product (GDP) Annualized for the second quarter (Q2) improved to 2.4% from 2.0% prior, versus 1.8% market forecast. On the same line, the US Durable Goods Orders also jumps 4.7% for June compared to 1.0% expected and 1.8% expected (revised). Additionally, Initial Jobless Claims declines to 221K for the week ended on July 21 versus 235K prior and analysts’ estimations of 228K. It should be observed that the US Pending Home Sales for June also improved to 0.3% MoM versus -0.5% expected and -2.5% prior (revised). However, the first estimations of the US Q2 Core Personal Consumption Expenditure eases to 3.8% QoQ from 4.9% prior and 4.0% market forecasts whereas GDP Price Index edges lower to 2.6% from 4.1% previous readings and 3.0% expected.
Moving on, the US Core PCE Price Index for June will be crucial to watch for clear directions of the USD/CAD price. Also important will be the monthly Canada GDP for May, expected 0.3% MoM versus 0.03% prior.
Daily closing beyond a one-week-old descending resistance line, now support around 1.3200, keeps the USD/CAD pair buyers hopeful.
Technical Levels: Supports and Resistances
USDCAD currently trading at 1.3227 at the time of writing. Pair opened at 1.3224 and is trading with a change of 0.02% % .
| Overview | Overview.1 | |
|---|---|---|
| 0 | Today last price | 1.3227 |
| 1 | Today Daily Change | 0.0003 |
| 2 | Today Daily Change % | 0.02% |
| 3 | Today daily open | 1.3224 |
The pair is trading above its 20 Daily moving average @ 1.3218, below its 50 Daily moving average @ 1.331 , below its 100 Daily moving average @ 1.3429 and below its 200 Daily moving average @ 1.3465
| Trends | Trends.1 | |
|---|---|---|
| 0 | Daily SMA20 | 1.3218 |
| 1 | Daily SMA50 | 1.3310 |
| 2 | Daily SMA100 | 1.3429 |
| 3 | Daily SMA200 | 1.3465 |
The previous day high was 1.3243 while the previous day low was 1.3158. The daily 38.2% Fib levels comes at 1.3211, expected to provide support. Similarly, the daily 61.8% fib level is at 1.3191, expected to provide support.
Note the levels of interest below:
- Pivot support is noted at 1.3173, 1.3123, 1.3088
- Pivot resistance is noted at 1.3259, 1.3294, 1.3344
| Levels | Levels.1 |
|---|---|
| Previous Daily High | 1.3243 |
| Previous Daily Low | 1.3158 |
| Previous Weekly High | 1.3244 |
| Previous Weekly Low | 1.3120 |
| Previous Monthly High | 1.3585 |
| Previous Monthly Low | 1.3117 |
| Daily Fibonacci 38.2% | 1.3211 |
| Daily Fibonacci 61.8% | 1.3191 |
| Daily Pivot Point S1 | 1.3173 |
| Daily Pivot Point S2 | 1.3123 |
| Daily Pivot Point S3 | 1.3088 |
| Daily Pivot Point R1 | 1.3259 |
| Daily Pivot Point R2 | 1.3294 |
| Daily Pivot Point R3 | 1.3344 |
[/s2If]
Download Nehcap EAWe have two EAs that are operational on our LIVE accounts.
- EA-FIX: Check out the details here. Download EA-FIX . EA-FIX is a non-grid HFT scalper.
- EA-GROWTH: High quality low dd EA using trend grids. Download EA_GROWTHJoin Our Telegram Group
")


