The GBP/USD currency pair remains stagnant at a low point over multiple days, following a significant decline comparable to March’s drop.
…
This is a premium post.
[s2If !current_user_can(access_s2member_level4)]Please register for FREE REGISTER to read full post below containing analysis. In case of any error or you think you are not able to read the full post below, please email us at support#nehcap.com [lwa][/s2If] [s2If current_user_can(access_s2member_level1)]
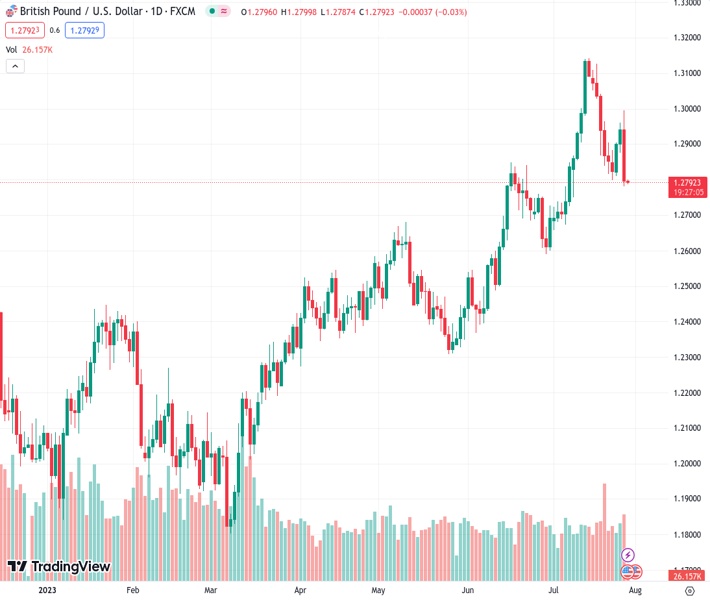
- GBP/USD treads water at multi-day low after falling the most since March.
The pair currently trades last at 1.27900.
The previous day high was 1.2996 while the previous day low was 1.2782. The daily 38.2% Fib levels comes at 1.2864, expected to provide resistance. Similarly, the daily 61.8% fib level is at 1.2914, expected to provide resistance.
GBP/USD licks its wounds at the lowest level in two weeks, making rounds to 1.2790-2800 during Friday’s Asian session, amid the market’s consolidation ahead of the Federal Reserve’s (Fed) preferred inflation gauge. It should be noted that the Cable pair dropped the most since early March the previous day after the US Dollar rallied on the upbeat data. Also weighing on the Pound Sterling price could be the concerns challenging the Bank of England (BoE) hawks.
On Thursday, Bloomberg came out with news suggesting the dislike among British Chancellor Jeremy Hunt’s advisers for the BoE’s rate hike considering the looming fears of an economic slowdown. The news signals the advisers’ fears of recession if the BoE fastens its rate hike trajectory.
On the other hand, the preliminary readings of the US Gross Domestic Product (GDP) Annualized for the second quarter (Q2) improved to 2.4% from 2.0% prior, versus 1.8% market forecast. On the same line, the US Durable Goods Orders also jumps 4.7% for June compared to 1.0% expected and 1.8% expected (revised). Additionally, Initial Jobless Claims declines to 221K for the week ended on July 21 versus 235K prior and analysts’ estimations of 228K. It should be observed that the US Pending Home Sales for June also improved to 0.3% MoM versus -0.5% expected and -2.5% prior (revised). However, the first estimations of the US Q2 Core Personal Consumption Expenditure eases to 3.8% QoQ from 4.9% prior and 4.0% market forecasts whereas GDP Price Index edges lower to 2.6% from 4.1% previous readings and 3.0% expected.
With this, US Dollar Index (DXY) posted the biggest daily jump since March 15 the previous day, not to forget mentioning a stellar rebound from the weekly low, as the US statistics recall the Fed hawks and bolstered the Treasury bond yields. It’s worth noting that the Wall Street benchmarks closed with nearly half a percent of daily losses whereas the benchmark US 10-year Treasury bond yields marked the biggest daily jump in a month to refresh a three-week high near 4.02%, close to 4.0% by the press time.
It should be observed that the market sentiment remains mildly positive of late and prod the US Dollar bulls by the press time despite fears of fresh US-China tension due to the White House’s readiness to stop the Hong Kong Leader from attending November’s Asia-Pacific Economic Cooperation (APEC) leaders’ summit in San Francisco.
Moving on, GBP/USD may benefit from the US Dollar’s retreat but is less likely to regain upside momentum amid the fears about the UK economy and the BoE. That said, today’s Fed’s favorite inflation gauge, namely the Core Personal Consumption Expenditure (PCE) Price Index for June, expected 4.2% YoY versus 4.6% prior, becomes crucial to watch for clear directions.
A daily closing beneath the two-month-old rising support line, now immediate resistance near 1.2820, directs the GBP/USD bears toward the 50-DMA support of around 1.2700.
Technical Levels: Supports and Resistances
GBPUSD currently trading at 1.279 at the time of writing. Pair opened at 1.2796 and is trading with a change of -0.05% % .
| Overview | Overview.1 | |
|---|---|---|
| 0 | Today last price | 1.279 |
| 1 | Today Daily Change | -0.0006 |
| 2 | Today Daily Change % | -0.05% |
| 3 | Today daily open | 1.2796 |
The pair is trading below its 20 Daily moving average @ 1.2882, above its 50 Daily moving average @ 1.269 , above its 100 Daily moving average @ 1.2546 and above its 200 Daily moving average @ 1.2278
| Trends | Trends.1 | |
|---|---|---|
| 0 | Daily SMA20 | 1.2882 |
| 1 | Daily SMA50 | 1.2690 |
| 2 | Daily SMA100 | 1.2546 |
| 3 | Daily SMA200 | 1.2278 |
The previous day high was 1.2996 while the previous day low was 1.2782. The daily 38.2% Fib levels comes at 1.2864, expected to provide resistance. Similarly, the daily 61.8% fib level is at 1.2914, expected to provide resistance.
Note the levels of interest below:
- Pivot support is noted at 1.272, 1.2644, 1.2506
- Pivot resistance is noted at 1.2934, 1.3072, 1.3148
| Levels | Levels.1 |
|---|---|
| Previous Daily High | 1.2996 |
| Previous Daily Low | 1.2782 |
| Previous Weekly High | 1.3126 |
| Previous Weekly Low | 1.2816 |
| Previous Monthly High | 1.2848 |
| Previous Monthly Low | 1.2369 |
| Daily Fibonacci 38.2% | 1.2864 |
| Daily Fibonacci 61.8% | 1.2914 |
| Daily Pivot Point S1 | 1.2720 |
| Daily Pivot Point S2 | 1.2644 |
| Daily Pivot Point S3 | 1.2506 |
| Daily Pivot Point R1 | 1.2934 |
| Daily Pivot Point R2 | 1.3072 |
| Daily Pivot Point R3 | 1.3148 |
[/s2If]
Download Nehcap EAWe have two EAs that are operational on our LIVE accounts.
- EA-FIX: Check out the details here. Download EA-FIX . EA-FIX is a non-grid HFT scalper.
- EA-GROWTH: High quality low dd EA using trend grids. Download EA_GROWTHJoin Our Telegram Group
")


