The price of silver, represented by XAGUSD, is experiencing an increase in buying activity after suffering its largest daily decline since June 20. However, the viewpoint of @nehcap is that the potential for further declines is limited.
…
This is a premium post.
[s2If !current_user_can(access_s2member_level4)]Please register for FREE REGISTER to read full post below containing analysis. In case of any error or you think you are not able to read the full post below, please email us at support#nehcap.com [lwa][/s2If] [s2If current_user_can(access_s2member_level1)]
- Silver Price picks up bids to pare the biggest daily loss since June 20.
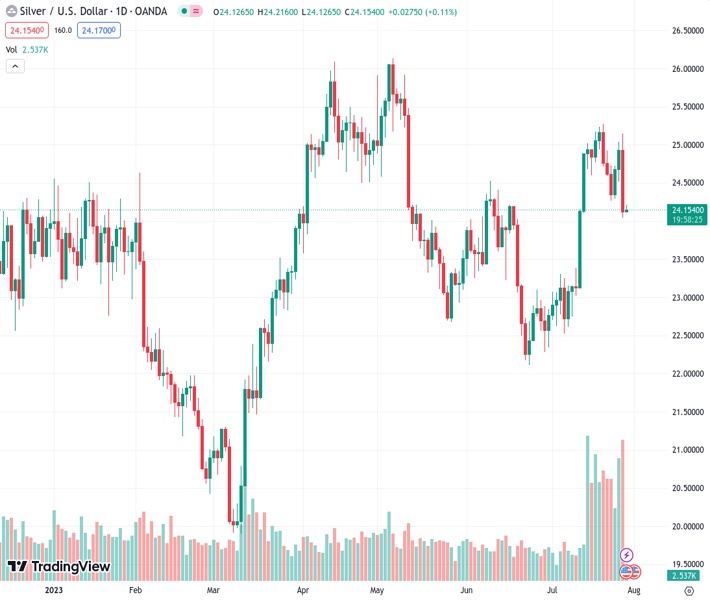
The pair currently trades last at 24.186.
The previous day high was 25.15 while the previous day low was 24.04. The daily 38.2% Fib levels comes at 24.47, expected to provide resistance. Similarly, the daily 61.8% fib level is at 24.73, expected to provide resistance.
Silver Price (XAG/USD) consolidates the previous day’s heavy losses by printing mild gains around $24.20 during early Friday morning in Asia. In doing so, the XAG/USD bounces off the 21-DMA while reversing from the lowest level in a fortnight.
Despite the latest recovery, the XAG/USD stays on the bear’s radar as it stays beneath the previous support line stretched from July 06 amid an impending bear cross on the MACD.
It’s worth noting that the 23.6% Fibonacci retracement of the Silver Price run-up during the March-May period joins the support-turned-resistance line to highlight $24.70 as the short-term key upside hurdle.
Following that, a downward-sloping resistance line from early May, near $25.20 at the latest, will be crucial to watch for the XAG/USD bulls before challenging the yearly top marked in May, close to $26.15.
On the flip side, a daily close beneath the 21-DMA support of $24.00 isn’t an open invitation to the Silver bears as the 50-DMA can challenge the downside near $23.60.
Above all, a convergence of an upward-sloping trend line from March 10 and a 50% Fibonacci retracement, close to $23.00 by the press time, appears a tough nut to crack for the XAG/USD bears.
Trend: Limited downside expected
Technical Levels: Supports and Resistances
XAGUSD currently trading at 24.18 at the time of writing. Pair opened at 24.13 and is trading with a change of 0.21% % .
| Overview | Overview.1 | |
|---|---|---|
| 0 | Today last price | 24.18 |
| 1 | Today Daily Change | 0.05 |
| 2 | Today Daily Change % | 0.21% |
| 3 | Today daily open | 24.13 |
The pair remains strongly bullish on the daily timeframe. It trades above its 20 SMA @ 24.01, 50 SMA 23.64, 100 SMA @ 23.88 and 200 SMA @ 23.03.
| Trends | Trends.1 | |
|---|---|---|
| 0 | Daily SMA20 | 24.01 |
| 1 | Daily SMA50 | 23.64 |
| 2 | Daily SMA100 | 23.88 |
| 3 | Daily SMA200 | 23.03 |
The previous day high was 25.15 while the previous day low was 24.04. The daily 38.2% Fib levels comes at 24.47, expected to provide resistance. Similarly, the daily 61.8% fib level is at 24.73, expected to provide resistance.
Note the levels of interest below:
- Pivot support is noted at 23.73, 23.34, 22.63
- Pivot resistance is noted at 24.84, 25.54, 25.94
| Levels | Levels.1 |
|---|---|
| Previous Daily High | 25.15 |
| Previous Daily Low | 24.04 |
| Previous Weekly High | 25.27 |
| Previous Weekly Low | 24.59 |
| Previous Monthly High | 24.53 |
| Previous Monthly Low | 22.11 |
| Daily Fibonacci 38.2% | 24.47 |
| Daily Fibonacci 61.8% | 24.73 |
| Daily Pivot Point S1 | 23.73 |
| Daily Pivot Point S2 | 23.34 |
| Daily Pivot Point S3 | 22.63 |
| Daily Pivot Point R1 | 24.84 |
| Daily Pivot Point R2 | 25.54 |
| Daily Pivot Point R3 | 25.94 |
[/s2If]
Download Nehcap EAWe have two EAs that are operational on our LIVE accounts.
- EA-FIX: Check out the details here. Download EA-FIX . EA-FIX is a non-grid HFT scalper.
- EA-GROWTH: High quality low dd EA using trend grids. Download EA_GROWTHJoin Our Telegram Group
")


