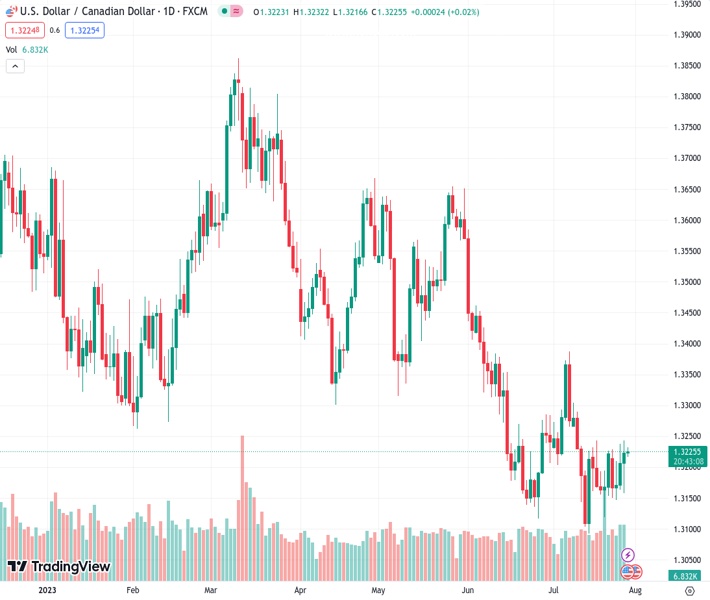
The US dollar’s strength is backing the USDCAD pair, which is currently trading at approximately 1.3225, representing a 0.02% increase throughout the day.
…
This is a premium post.
[s2If !current_user_can(access_s2member_level4)]Please register for FREE REGISTER to read full post below containing analysis. In case of any error or you think you are not able to read the full post below, please email us at support#nehcap.com [lwa][/s2If] [s2If current_user_can(access_s2member_level1)]
- The stronger Greenback supports USD/CAD, trading at around 1.3225, up 0.02% for the day.
The pair currently trades last at 1.32265.
The previous day high was 1.3238 while the previous day low was 1.3169. The daily 38.2% Fib levels comes at 1.3211, expected to provide support. Similarly, the daily 61.8% fib level is at 1.3191, expected to provide support.
The USD/CAD pair attracts some buyers and jumps to 1.3225 during the early Asian session on Friday. The Greenback gains momentum following the upbeat US economic data on Thursday. Market participants will keep an eye on the Canadian Gross Domestic Product (GDP) and the US Core Personal Consumption Expenditure (PCE) data for fresh impetus later in the North American session.
The data released on Thursday showed the US real Gross Domestic Product (GDP) expanded at a 2.4% annualized rate, above the market consensus of 1.8% by a wide margin and following the 2% growth reported in the first quarter. Additionally, the GDP Price Index in the second quarter decreased to 2.6% from 4.1% in the first quarter, and the Core Personal Consumption Expenditures decreased to 3.8% from 4.8% in the same period. The annual figure is expected to drop from 4.6% to 4.2%.
Furthermore, Durable Goods Orders rose 4.7% on a monthly basis to $302.5 billion. Initial Jobless Claims declined by 7,000 to 221,000 in the week ending July 22. It is the lowest reading in five months.
Following the July policy meeting, the Federal Open Market Committee (FOMC) hiked its interest rate by a quarter percentage point to a target range of 5.25%–5.5%, as expected. It is the 11th rate hike since the FOMC began tightening policy in March 2022. Fed Chairman Jerome Powell stated that the FOMC will assess the totality of incoming data and its implications for economic activity and inflation. He added that it’s possible to raise the Fed funds rate again at the September meeting if the data warrants it.
Earlier this week, the Conference Board’s Consumer Confidence Index rose to 117 in July from 110.1 (revised from 109) in June. On the same line, the House Price Index for May YoY came in at 2.8%, above expectations of 2.6% but below the prior month’s data.
On the other hand, market players anticipated that the Bank of Canada (BoC) would likely not see the need to raise rates further this year. According to a survey of market participants released by the central bank on Monday, a median of the participants anticipate the bank to maintain interest rates at a 22-year high of 5.00% until the end of 2023 before cutting the rates in March.
However, gains in the oil and gas sectors offset a slowdown in the manufacturing sector. Crude oil has gained for four consecutive weeks as supply is expected to tighten. It’s worth noting that Canada is the leading oil exporter to the United States, and higher crude prices strengthen the Canadian Dollar.
Later in the day, attention will turn to the Canadian Gross Domestic Product (GDP) data. The figure is expected to rise by 0.3% from the previous reading of 0%. The US Core Personal Consumption Expenditure (PCE) index, the Fed’s preferred inflation gauge, will be released from the US docket. The inflation figure is expected to drop from 4.6% to 4.2% annually. Market players will take cues from this data and find opportunities around the USD/CAD pair.
Technical Levels: Supports and Resistances
USDCAD currently trading at 1.3228 at the time of writing. Pair opened at 1.3208 and is trading with a change of 0.15 % .
| Overview | Overview.1 | |
|---|---|---|
| 0 | Today last price | 1.3228 |
| 1 | Today Daily Change | 0.0020 |
| 2 | Today Daily Change % | 0.1500 |
| 3 | Today daily open | 1.3208 |
The pair is trading above its 20 Daily moving average @ 1.3218, below its 50 Daily moving average @ 1.331 , below its 100 Daily moving average @ 1.3429 and below its 200 Daily moving average @ 1.3465
| Trends | Trends.1 | |
|---|---|---|
| 0 | Daily SMA20 | 1.3218 |
| 1 | Daily SMA50 | 1.3310 |
| 2 | Daily SMA100 | 1.3429 |
| 3 | Daily SMA200 | 1.3465 |
The previous day high was 1.3238 while the previous day low was 1.3169. The daily 38.2% Fib levels comes at 1.3211, expected to provide support. Similarly, the daily 61.8% fib level is at 1.3191, expected to provide support.
Note the levels of interest below:
- Pivot support is noted at 1.3173, 1.3123, 1.3088
- Pivot resistance is noted at 1.3259, 1.3294, 1.3344
| Levels | Levels.1 |
|---|---|
| Previous Daily High | 1.3238 |
| Previous Daily Low | 1.3169 |
| Previous Weekly High | 1.3244 |
| Previous Weekly Low | 1.3120 |
| Previous Monthly High | 1.3585 |
| Previous Monthly Low | 1.3117 |
| Daily Fibonacci 38.2% | 1.3211 |
| Daily Fibonacci 61.8% | 1.3191 |
| Daily Pivot Point S1 | 1.3173 |
| Daily Pivot Point S2 | 1.3123 |
| Daily Pivot Point S3 | 1.3088 |
| Daily Pivot Point R1 | 1.3259 |
| Daily Pivot Point R2 | 1.3294 |
| Daily Pivot Point R3 | 1.3344 |
[/s2If]
Download Nehcap EAWe have two EAs that are operational on our LIVE accounts.
- EA-FIX: Check out the details here. Download EA-FIX . EA-FIX is a non-grid HFT scalper.
- EA-GROWTH: High quality low dd EA using trend grids. Download EA_GROWTHJoin Our Telegram Group
")


