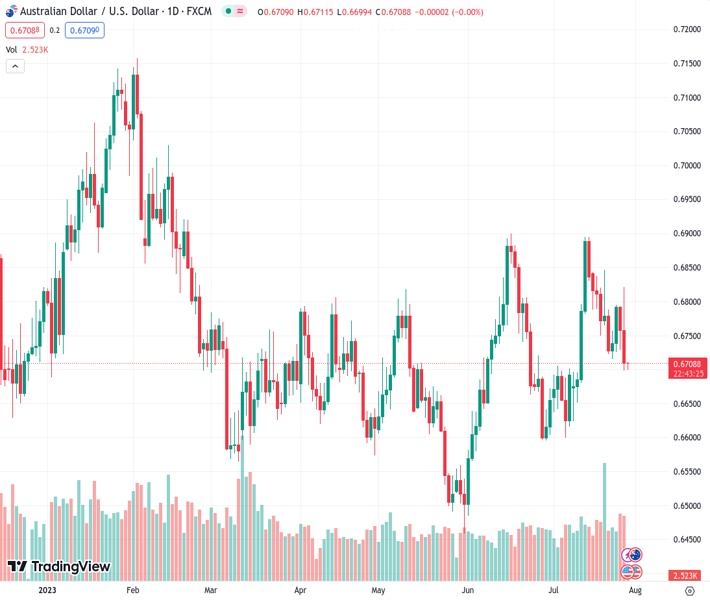
The AUDUSD pair, currently at 0.67087, is recovering from a rough day of trading marked by high volatility. The day concluded with significant losses, causing the pair to reach its lowest point in the past 13 days.
…
This is a premium post.
[s2If !current_user_can(access_s2member_level4)]Please register for FREE REGISTER to read full post below containing analysis. In case of any error or you think you are not able to read the full post below, please email us at support#nehcap.com [lwa][/s2If] [s2If current_user_can(access_s2member_level1)]
- AUD/USD licks its wounds at 13-day low after a volatile day that ended on a negative side with heavy losses.
The pair currently trades last at 0.67087.
The previous day high was 0.6794 while the previous day low was 0.673. The daily 38.2% Fib levels comes at 0.6755, expected to provide resistance. Similarly, the daily 61.8% fib level is at 0.677, expected to provide resistance.
AUD/USD bears attack two-month-old support amid early hours of Friday’s Asian session after a volatile day for the pair that initially refreshed the weekly high before closing with the biggest daily loss in a week to around 0.6700. That said, the quote currently portrays pre-data anxiety following a whippy day that ran from firmer sentiment and softer US dollars to a jump in the greenback and mixed mood.
AUD/USD initially cheered the market’s easing fears of the Federal Reserve’s (Fed) rate hike and upbeat China Industrial Profits, as well as hopes of more stimulus from Beijing, to refresh the weekly top before the US GDP-led slump. Also weighing on the Aussie pair could be the cautious mood ahead of today’s top-tier Aussie and the US data.
US Dollar Index (DXY) posted the biggest daily jump since March 15 the previous day, not to forget mentioning a stellar rebound from the weekly low, as the US statistics recall the Fed hawks and bolstered the Treasury bond yields. It’s worth noting that the Wall Street benchmarks closed with nearly half a percent of daily losses whereas the benchmark US 10-year Treasury bond yields marked the biggest daily jump in a month to refresh a three-week high near 4.02%, close to 4.0% by the press time.
That said, the preliminary readings of the US Gross Domestic Product (GDP) Annualized for the second quarter (Q2) improved to 2.4% from 2.0% prior, versus 1.8% market forecast. On the same line, the US Durable Goods Orders also jumps 4.7% for June compared to 1.0% expected and 1.8% expected (revised). Additionally, Initial Jobless Claims declines to 221K for the week ended on July 21 versus 235K prior and analysts’ estimations of 228K. It should be observed that the US Pending Home Sales for June also improved to 0.3% MoM versus -0.5% expected and -2.5% prior (revised).
However, the first estimations of the US Q2 Core Personal Consumption Expenditure eases to 3.8% QoQ from 4.9% prior and 4.0% market forecasts whereas GDP Price Index edges lower to 2.6% from 4.1% previous readings and 3.0% expected.
At home, Australia’s Export Price Index slumped to -8.5% QoQ while the Import Price Index improved to -0.8% QoQ versus 1.6% and -4.2% respective priors. That said, China’s Industrial Profits for the January-June period improve to -16.8% compared to the -18.8% figure marked for the first five months of the year 2023, per China’s National Bureau of Statistics (NBS) data.
Looking ahead, AUD/USD pair traders may witness a lackluster day as top-tier data/events are scheduled for publishing in Asia, as well as in the US session. That said, Australia’s Q2 Producer Price Index, expected to ease to 3.9% YoY from 5.2% prior, will precede the Aussie Retail Sales for June, bearing downbeat forecasts of 0.0% MoM versus 0.7% prior, to entertain traders in Asia. Following that, the Fed’s favorite inflation gauge, namely the Core Personal Consumption Expenditure (PCE) Price Index for June, expected 4.2% YoY versus 4.6% prior, will be crucial to watch for clear directions.
AUD/USD clings to a two-month-old rising support line surrounding 0.6700 after providing the first daily closing beneath the 200-SMA, around 0.6730 by the press time, in more than two weeks.
Technical Levels: Supports and Resistances
AUDUSD currently trading at 0.6708 at the time of writing. Pair opened at 0.6758 and is trading with a change of -0.74% % .
| Overview | Overview.1 | |
|---|---|---|
| 0 | Today last price | 0.6708 |
| 1 | Today Daily Change | -0.0050 |
| 2 | Today Daily Change % | -0.74% |
| 3 | Today daily open | 0.6758 |
The pair is trading below its 20 Daily moving average @ 0.6735, above its 50 Daily moving average @ 0.6697 , above its 100 Daily moving average @ 0.6691 and below its 200 Daily moving average @ 0.6725
| Trends | Trends.1 | |
|---|---|---|
| 0 | Daily SMA20 | 0.6735 |
| 1 | Daily SMA50 | 0.6697 |
| 2 | Daily SMA100 | 0.6691 |
| 3 | Daily SMA200 | 0.6725 |
The previous day high was 0.6794 while the previous day low was 0.673. The daily 38.2% Fib levels comes at 0.6755, expected to provide resistance. Similarly, the daily 61.8% fib level is at 0.677, expected to provide resistance.
Note the levels of interest below:
- Pivot support is noted at 0.6728, 0.6697, 0.6664
- Pivot resistance is noted at 0.6791, 0.6824, 0.6854
| Levels | Levels.1 |
|---|---|
| Previous Daily High | 0.6794 |
| Previous Daily Low | 0.6730 |
| Previous Weekly High | 0.6854 |
| Previous Weekly Low | 0.6722 |
| Previous Monthly High | 0.6900 |
| Previous Monthly Low | 0.6484 |
| Daily Fibonacci 38.2% | 0.6755 |
| Daily Fibonacci 61.8% | 0.6770 |
| Daily Pivot Point S1 | 0.6728 |
| Daily Pivot Point S2 | 0.6697 |
| Daily Pivot Point S3 | 0.6664 |
| Daily Pivot Point R1 | 0.6791 |
| Daily Pivot Point R2 | 0.6824 |
| Daily Pivot Point R3 | 0.6854 |
[/s2If]
Download Nehcap EAWe have two EAs that are operational on our LIVE accounts.
- EA-FIX: Check out the details here. Download EA-FIX . EA-FIX is a non-grid HFT scalper.
- EA-GROWTH: High quality low dd EA using trend grids. Download EA_GROWTHJoin Our Telegram Group
")


