Dip-buying in the NZDUSD currency pair occurred on Wednesday at the price of 0.62208, while also receiving support from a slight decrease in the strength of the USD.
…
This is a premium post.
[s2If !current_user_can(access_s2member_level4)]Please register for FREE REGISTER to read full post below containing analysis. In case of any error or you think you are not able to read the full post below, please email us at support#nehcap.com [lwa][/s2If] [s2If current_user_can(access_s2member_level1)]
- NZD/USD attracts dip-buying on Wednesday and draws support from modest USD weakness.
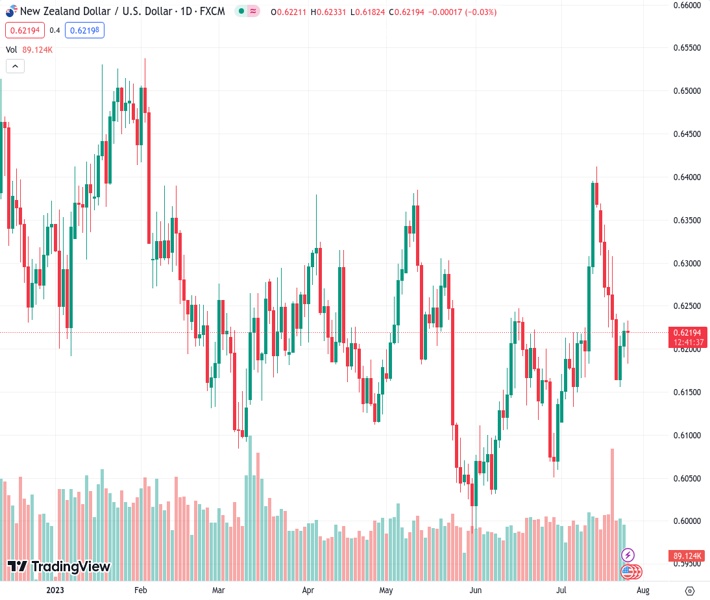
The pair currently trades last at 0.62208.
The previous day high was 0.623 while the previous day low was 0.6189. The daily 38.2% Fib levels comes at 0.6214, expected to provide support. Similarly, the daily 61.8% fib level is at 0.6205, expected to provide support.
The NZD/USD pair recovers a major part of its modest intraday losses to the 0.6180 area and climbs back closer to the top end of its daily range during the early European session. Spot prices currently trade around the 0.6220-0.6225 region and look to build on the recent gains registered over the past two days, from the 0.6155 region, or a two-week low touched on Monday.
The US Dollar (USD) drifts lower for the second successive day and retreats further from a two-week high set the previous day, which, in turn, assists the NZD/USD pair to attract some dip-buying at lower levels. Furthermore, the latest optimism led by expectations that the Chinese government will roll out more measures to support the economy remains supportive of the prevalent risk-on environment. This is seen as another factor acting as a tailwind for the risk-sensitive Kiwi, though the upside seems limited as traders seem reluctant to place aggressive bets ahead of the highly-anticipated FOMC monetary policy decision.
The US central bank is widely expected to raise borrowing costs by 25 bps. Investors, meanwhile, remain sceptic if the Federal Reserve (Fed) will commit to a more dovish stance in the wake of an extremely resilient US economy. The markets, however, have been pricing out the possibility of any further interest rate hikes this year. Hence, the accompanying monetary policy statement and Fed Chair Jerome Powell’s comments at the post-meeting press conference will be scrutinized for cues about the future rate-hike path. This, in turn, will drive the USD demand and provide a fresh directional impetus to the NZD/USD pair.
Heading into the key central bank event risk, traders on Wednesday will confront the release of New Home Sales data from the US. The data, however, might do little to provide any meaningful impetus to the buck. The downside for the NZD/USD pair, meanwhile, seems cushioned in the wake of expectations for a more hawkish Reserve Bank of New Zealand (RBNZ), bolstered by stronger domestic consumer inflation figures released last week. This, in turn, suggests that the path of least resistance for spot prices is to the upside and the recent corrective slide from a multi-month peak might have already run its course.
Technical Levels: Supports and Resistances
NZDUSD currently trading at 0.6221 at the time of writing. Pair opened at 0.6222 and is trading with a change of -0.02 % .
| Overview | Overview.1 | |
|---|---|---|
| 0 | Today last price | 0.6221 |
| 1 | Today Daily Change | -0.0001 |
| 2 | Today Daily Change % | -0.0200 |
| 3 | Today daily open | 0.6222 |
The pair remains strongly bullish on the daily timeframe. It trades above its 20 SMA @ 0.6215, 50 SMA 0.6169, 100 SMA @ 0.6196 and 200 SMA @ 0.6212.
| Trends | Trends.1 | |
|---|---|---|
| 0 | Daily SMA20 | 0.6215 |
| 1 | Daily SMA50 | 0.6169 |
| 2 | Daily SMA100 | 0.6196 |
| 3 | Daily SMA200 | 0.6212 |
The previous day high was 0.623 while the previous day low was 0.6189. The daily 38.2% Fib levels comes at 0.6214, expected to provide support. Similarly, the daily 61.8% fib level is at 0.6205, expected to provide support.
Note the levels of interest below:
- Pivot support is noted at 0.6197, 0.6173, 0.6156
- Pivot resistance is noted at 0.6239, 0.6255, 0.628
| Levels | Levels.1 |
|---|---|
| Previous Daily High | 0.6230 |
| Previous Daily Low | 0.6189 |
| Previous Weekly High | 0.6370 |
| Previous Weekly Low | 0.6163 |
| Previous Monthly High | 0.6250 |
| Previous Monthly Low | 0.5990 |
| Daily Fibonacci 38.2% | 0.6214 |
| Daily Fibonacci 61.8% | 0.6205 |
| Daily Pivot Point S1 | 0.6197 |
| Daily Pivot Point S2 | 0.6173 |
| Daily Pivot Point S3 | 0.6156 |
| Daily Pivot Point R1 | 0.6239 |
| Daily Pivot Point R2 | 0.6255 |
| Daily Pivot Point R3 | 0.6280 |
[/s2If]
Download Nehcap EAWe have two EAs that are operational on our LIVE accounts.
- EA-FIX: Check out the details here. Download EA-FIX . EA-FIX is a non-grid HFT scalper.
- EA-GROWTH: High quality low dd EA using trend grids. Download EA_GROWTHJoin Our Telegram Group
")


