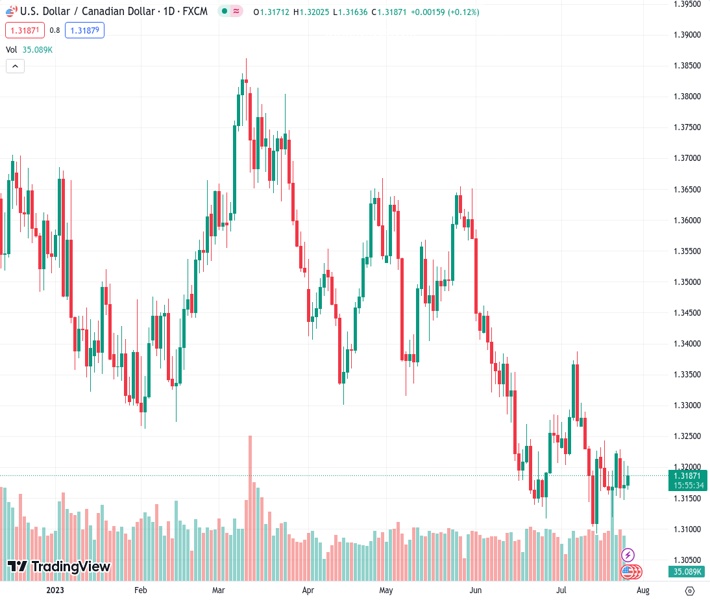
The USDCAD currency pair is finding it difficult to maintain upward momentum beyond the 1.3200 level on Wednesday.
…
This is a premium post.
[s2If !current_user_can(access_s2member_level4)]Please register for FREE REGISTER to read full post below containing analysis. In case of any error or you think you are not able to read the full post below, please email us at support#nehcap.com [lwa][/s2If] [s2If current_user_can(access_s2member_level1)]
- USD/CAD struggles to gain momentum beyond the 1.3200 area on Wednesday.
The pair currently trades last at 1.31901.
The previous day high was 1.3209 while the previous day low was 1.3147. The daily 38.2% Fib levels comes at 1.3185, expected to provide support. Similarly, the daily 61.8% fib level is at 1.3171, expected to provide support.
The USD/CAD pair attracts some follow-through buying but struggles to gain momentum beyond the 1.3200 area during the Asian session on Wednesday. Traders await the closely-watched Federal Open Market Committee (FOMC) meeting scheduled later in the North American session. The major pair is trading at 1.3185, gaining 0.09% for the day.
The Conference Board survey revealed that US consumer confidence reached a two-year high in July. The figure rose to 117.0 from 110.1 (revised from 109.7) in June, the highest reading since July 2021. The data bolstered optimism that the economy could avoid a recession this year. This, in turn, could support the greenback and cap the upside in the commodity-linked Loonie.
According to the four-hour chart, the path of least resistance for the USD/CAD is to the downside as the major pair holds below the 50- and 100-hour Exponential Moving Averages (EMAs) with a downward slope. Meanwhile, the Relative Strength Index (RSI) stands slightly above 50, highlighting the non-directional movement of the pair.
That said, the immediate resistance level is seen at 1.3200, representing the confluence of a psychological round mark and the 100-hour EMA. Any meaningful follow-through buying above the latter will see a rally to the next barrier at 1.3230 (High of July 17). Following that, the June 15 swing high of 1.3355 will be in focus. The 1.3390–1.3400 zone appears to be a tough nut to crack for USD/CAD.
Looking at the downside, any extended weakness below 1.3145 (Low of July 25) will challenge the next downside filter at 1.3120 (Low of July 20) and 1.3090 (Low of July 14).
Technical Levels: Supports and Resistances
USDCAD currently trading at 1.3183 at the time of writing. Pair opened at 1.3172 and is trading with a change of 0.08 % .
| Overview | Overview.1 | |
|---|---|---|
| 0 | Today last price | 1.3183 |
| 1 | Today Daily Change | 0.0011 |
| 2 | Today Daily Change % | 0.0800 |
| 3 | Today daily open | 1.3172 |
The pair remains strongly bearish on the daily time frame. It trades below the 20 SMA @ 1.3222, 50 SMA 1.3321, 100 SMA @ 1.3441 and 200 SMA @ 1.3471.
| Trends | Trends.1 | |
|---|---|---|
| 0 | Daily SMA20 | 1.3222 |
| 1 | Daily SMA50 | 1.3321 |
| 2 | Daily SMA100 | 1.3441 |
| 3 | Daily SMA200 | 1.3471 |
The previous day high was 1.3209 while the previous day low was 1.3147. The daily 38.2% Fib levels comes at 1.3185, expected to provide support. Similarly, the daily 61.8% fib level is at 1.3171, expected to provide support.
Note the levels of interest below:
- Pivot support is noted at 1.3143, 1.3114, 1.308
- Pivot resistance is noted at 1.3205, 1.3238, 1.3268
| Levels | Levels.1 |
|---|---|
| Previous Daily High | 1.3209 |
| Previous Daily Low | 1.3147 |
| Previous Weekly High | 1.3244 |
| Previous Weekly Low | 1.3120 |
| Previous Monthly High | 1.3585 |
| Previous Monthly Low | 1.3117 |
| Daily Fibonacci 38.2% | 1.3185 |
| Daily Fibonacci 61.8% | 1.3171 |
| Daily Pivot Point S1 | 1.3143 |
| Daily Pivot Point S2 | 1.3114 |
| Daily Pivot Point S3 | 1.3080 |
| Daily Pivot Point R1 | 1.3205 |
| Daily Pivot Point R2 | 1.3238 |
| Daily Pivot Point R3 | 1.3268 |
[/s2If]
Download Nehcap EAWe have two EAs that are operational on our LIVE accounts.
- EA-FIX: Check out the details here. Download EA-FIX . EA-FIX is a non-grid HFT scalper.
- EA-GROWTH: High quality low dd EA using trend grids. Download EA_GROWTHJoin Our Telegram Group
")


