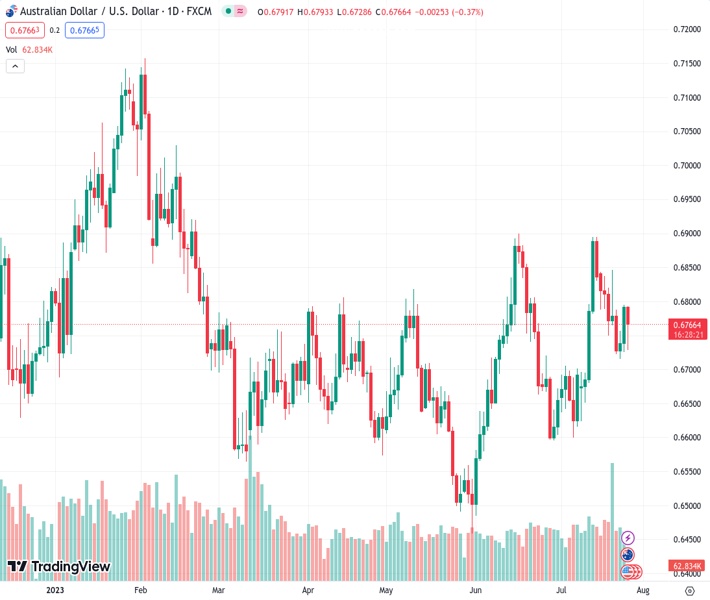
The AUDUSD pair, currently at a rate of 0.67646, has declined towards the previous low reached during the night but has not shown significant continuation in its downward movement.
…
This is a premium post.
[s2If !current_user_can(access_s2member_level4)]Please register for FREE REGISTER to read full post below containing analysis. In case of any error or you think you are not able to read the full post below, please email us at support#nehcap.com [lwa][/s2If] [s2If current_user_can(access_s2member_level1)]
- AUD/USD drops back closer to the overnight swing low, albeit lacks follow-through.
The pair currently trades last at 0.67646.
The previous day high was 0.6795 while the previous day low was 0.6725. The daily 38.2% Fib levels comes at 0.6768, expected to provide resistance. Similarly, the daily 61.8% fib level is at 0.6752, expected to provide support.
The AUD/USD pair comes under heavy selling pressure following the release of softer Australian consumer inflation figures on Wednesday, albeit manages to find support near the overnight swing low, around the 0.6730-0.6725 area. Spot prices recover nearly 35 pips from the daily trough and currently trade around the 0.6760-0.6765 region, down over 0.40% for the day.
The Australian Dollar (AUD) weakens across the board after the Australian Bureau of Statistics reported that the headline CPI rose 0.8% in the second quarter, lower than the 1% estimated and well below the 1.4% previous. Furthermore, the yearly rate also missed market expectations and decelerated from 7.0% to 6.2% during the reported period. Adding to this, the Reserve Bank of Australia’s (RBA) preferred measure of trimmed-mean CPI grew by a 5.9% YoY rate in the June quarter, down from 6.6% the previous quarter. The data strengthens the case for the RBA to pause future rate hikes and weigh on the domestic currency, which, along with a modest US Dollar (USD) uptick, prompt aggressive selling around the AUD/USD pair.
In fact, the USD Index (DXY), which tracks the Greenback against a basket of currencies, inches back closer to a two-week high touched on Tuesday and draws support from Tuesday’s upbeat US macro data, which pointed to an extremely resilient economy. It is worth recalling that the survey from the Conference Board showed that US consumer confidence jumped to a two-year high in July in the wake of a persistently tight labour market and receding inflationary pressures. This raises optimism that the economy could skip a recession this year and lends some support to the Greenback. The USD bulls, however, refrain from placing fresh bets and prefer to wait for fresh cues about the Federal Reserve’s (Fed) policy outlook.
The markets have been pricing out the possibility of any further interest rate hikes after the widely anticipated 25 bps lift-off at the end of a two-day FOMC monetary policy meeting this Wednesday. Investors, however, seem sceptic if the Fed will commit to a more dovish stance. Hence, the focus will remain glued to the accompanying monetary policy statement and Fed Chair Jerome Powell’s remarks at the post-meeting press conference, which will be scrutinized for the future rate-hike path. This, in turn, will influence the USD price dynamics and provide a fresh directional impetus to the AUD/USD pair.
In the meantime, the latest optimism led by hopes for more stimulus measures from China remains supportive of the underlying bullish sentiment around the global equity markets. This is seen as another factor capping gains for the safe-haven buck and lending some support to the risk-sensitive Aussie, making it prudent to wait for strong follow-through selling before placing fresh bearish bets around the AUD/USD pair.
Technical Levels: Supports and Resistances
AUDUSD currently trading at 0.6763 at the time of writing. Pair opened at 0.6792 and is trading with a change of -0.43 % .
| Overview | Overview.1 | |
|---|---|---|
| 0 | Today last price | 0.6763 |
| 1 | Today Daily Change | -0.0029 |
| 2 | Today Daily Change % | -0.4300 |
| 3 | Today daily open | 0.6792 |
The pair remains strongly bullish on the daily timeframe. It trades above its 20 SMA @ 0.6727, 50 SMA 0.6695, 100 SMA @ 0.6689 and 200 SMA @ 0.6723.
| Trends | Trends.1 | |
|---|---|---|
| 0 | Daily SMA20 | 0.6727 |
| 1 | Daily SMA50 | 0.6695 |
| 2 | Daily SMA100 | 0.6689 |
| 3 | Daily SMA200 | 0.6723 |
The previous day high was 0.6795 while the previous day low was 0.6725. The daily 38.2% Fib levels comes at 0.6768, expected to provide resistance. Similarly, the daily 61.8% fib level is at 0.6752, expected to provide support.
Note the levels of interest below:
- Pivot support is noted at 0.6747, 0.6701, 0.6677
- Pivot resistance is noted at 0.6816, 0.684, 0.6886
| Levels | Levels.1 |
|---|---|
| Previous Daily High | 0.6795 |
| Previous Daily Low | 0.6725 |
| Previous Weekly High | 0.6854 |
| Previous Weekly Low | 0.6722 |
| Previous Monthly High | 0.6900 |
| Previous Monthly Low | 0.6484 |
| Daily Fibonacci 38.2% | 0.6768 |
| Daily Fibonacci 61.8% | 0.6752 |
| Daily Pivot Point S1 | 0.6747 |
| Daily Pivot Point S2 | 0.6701 |
| Daily Pivot Point S3 | 0.6677 |
| Daily Pivot Point R1 | 0.6816 |
| Daily Pivot Point R2 | 0.6840 |
| Daily Pivot Point R3 | 0.6886 |
[/s2If]
Download Nehcap EAWe have two EAs that are operational on our LIVE accounts.
- EA-FIX: Check out the details here. Download EA-FIX . EA-FIX is a non-grid HFT scalper.
- EA-GROWTH: High quality low dd EA using trend grids. Download EA_GROWTHJoin Our Telegram Group
")


