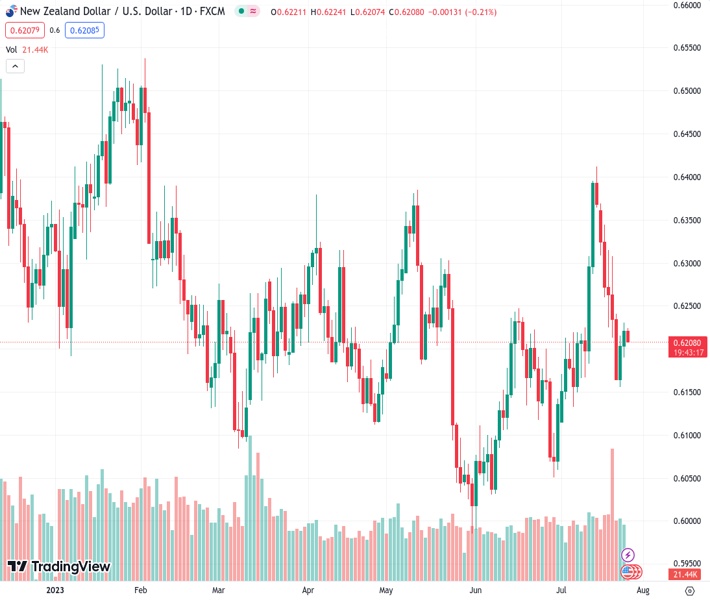
The currency pair NZDUSD, which was at a value of 0.62095, encountered resistance on Tuesday causing it to break its two-day period of gains.
…
This is a premium post.
[s2If !current_user_can(access_s2member_level4)]Please register for FREE REGISTER to read full post below containing analysis. In case of any error or you think you are not able to read the full post below, please email us at support#nehcap.com [lwa][/s2If] [s2If current_user_can(access_s2member_level1)]
- NZD/USD meets with some supply on Tuesday and snaps a two-day winning streak.
The pair currently trades last at 0.62095.
The previous day high was 0.623 while the previous day low was 0.6189. The daily 38.2% Fib levels comes at 0.6214, expected to provide resistance. Similarly, the daily 61.8% fib level is at 0.6205, expected to provide support.
The NZD/USD pair struggles to capitalize on its gains registered over the past two days, from the 0.6115 area or a two-week low, and edges lower during the Asian session on Wednesday. Spot prices, however, manage to hold above the 0.6200 round figure as traders keenly await cues about the Federal Reserve’s (Fed) future rate-hike path.
It is worth recalling that the markets have been pricing out the possibility of any further rate hikes after the widely expected 25 bps lift-off at the end of a two-day FOMC policy meeting later this Wednesday. Investors, however, remain sceptic if the US central bank will commit to a more dovish stance. Hence, the focus will remain glued to the accompanying monetary policy statement and Fed Chair Jerome Powell’s comments during the post-meeting press conference. This will play a key role in influencing the near-term US Dollar (USD) price dynamics and determining the next leg of a directional move for the NZD/USD pair.
In the meantime, signs of an extremely resilient US economy assist the USD Index (DXY), which tracks the Greenback against a basket of currencies, to hold steady just below the two-week high touched on Tuesday. This, along with the worsening US-China trade ties and geopolitical risks, exerts some downward pressure on the NZD/USD pair. Traders, however, seem reluctant to place aggressive bets and might prefer to wait on the sidelines heading into the key central bank event risk. This warrants caution before positioning for the resumption of the recent pullback from a multi-month peak – levels just above the 0.6400 mark.
From a technical perspective, the NZD/USD pair earlier this week managed to defend and rebound from a support marked by the 61.8% Fibonacci retracement level of the June-July rally. The subsequent move and acceptance above a confluence, comprising the 100-day Simple Moving Average (SMA) and the 50% Fibo. level, supports prospects for the emergence of some dip-buying. That said, it will still be prudent to wait for a sustained move beyond the 38.2% Fibo. resistance near mid-0.6200s before placing fresh bullish bets in the absence of a fresh fundamental catalyst and market-moving macro data from New Zealand.
Technical Levels: Supports and Resistances
NZDUSD currently trading at 0.6213 at the time of writing. Pair opened at 0.6222 and is trading with a change of -0.14 % .
| Overview | Overview.1 | |
|---|---|---|
| 0 | Today last price | 0.6213 |
| 1 | Today Daily Change | -0.0009 |
| 2 | Today Daily Change % | -0.1400 |
| 3 | Today daily open | 0.6222 |
The pair is trading below its 20 Daily moving average @ 0.6215, above its 50 Daily moving average @ 0.6169 , above its 100 Daily moving average @ 0.6196 and above its 200 Daily moving average @ 0.6212
| Trends | Trends.1 | |
|---|---|---|
| 0 | Daily SMA20 | 0.6215 |
| 1 | Daily SMA50 | 0.6169 |
| 2 | Daily SMA100 | 0.6196 |
| 3 | Daily SMA200 | 0.6212 |
The previous day high was 0.623 while the previous day low was 0.6189. The daily 38.2% Fib levels comes at 0.6214, expected to provide resistance. Similarly, the daily 61.8% fib level is at 0.6205, expected to provide support.
Note the levels of interest below:
- Pivot support is noted at 0.6197, 0.6173, 0.6156
- Pivot resistance is noted at 0.6239, 0.6255, 0.628
| Levels | Levels.1 |
|---|---|
| Previous Daily High | 0.6230 |
| Previous Daily Low | 0.6189 |
| Previous Weekly High | 0.6370 |
| Previous Weekly Low | 0.6163 |
| Previous Monthly High | 0.6250 |
| Previous Monthly Low | 0.5990 |
| Daily Fibonacci 38.2% | 0.6214 |
| Daily Fibonacci 61.8% | 0.6205 |
| Daily Pivot Point S1 | 0.6197 |
| Daily Pivot Point S2 | 0.6173 |
| Daily Pivot Point S3 | 0.6156 |
| Daily Pivot Point R1 | 0.6239 |
| Daily Pivot Point R2 | 0.6255 |
| Daily Pivot Point R3 | 0.6280 |
[/s2If]
Download Nehcap EAWe have two EAs that are operational on our LIVE accounts.
- EA-FIX: Check out the details here. Download EA-FIX . EA-FIX is a non-grid HFT scalper.
- EA-GROWTH: High quality low dd EA using trend grids. Download EA_GROWTHJoin Our Telegram Group
")


