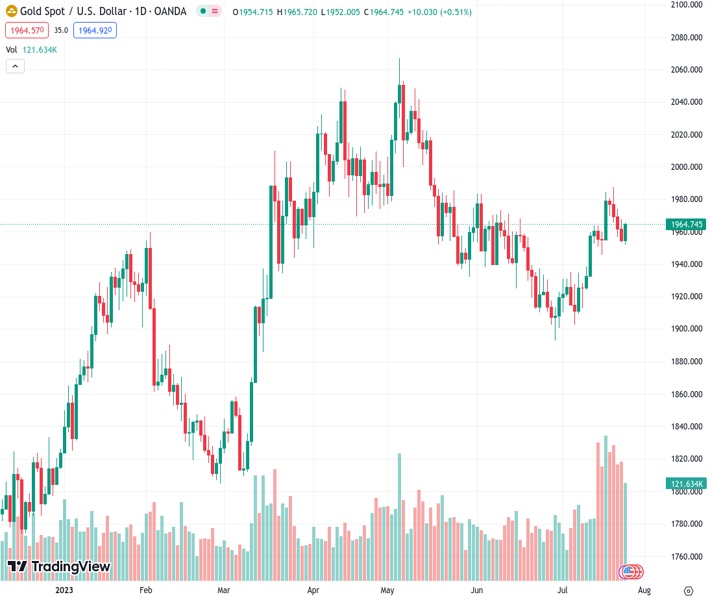
The XAUUSD, currently standing at 1,964.23, has recovered after experiencing four days of declines and has now surged above the 100-day Simple Moving Average (SMA).
…
This is a premium post.
[s2If !current_user_can(access_s2member_level4)]Please register for FREE REGISTER to read full post below containing analysis. In case of any error or you think you are not able to read the full post below, please email us at support#nehcap.com [lwa][/s2If] [s2If current_user_can(access_s2member_level1)]
- XAU/USD rebounds from 4 consecutive days of losses and jumped above the 100-day SMA.
The pair currently trades last at 1964.23.
The previous day high was 1967.94 while the previous day low was 1953.53. The daily 38.2% Fib levels comes at 1959.03, expected to provide support. Similarly, the daily 61.8% fib level is at 1962.44, expected to provide support.
After a lacklustre start to the week for the XAU/USD, it traded with gains in Tuesday’s session, jumping above $1,960 with 0.50% gains. Ahead of the Federal Reserve (Fed) decision on Wednesday, the American yields are trading mixed, with the 2-year rate showing a 1% decline but the 10-year slightly rising to 3.88%.
On the data front, the Housing Price Index from the Federal Housing Agency and S&P/Case-Shiller Home Price Indices (YoY) for May came in higher than expected at 0.7% and -1.7%, respectively. The Richmond Fed Manufacturing Index from July came in at -9, slightly better than the expected -10.
That being said, tightening expectations by the Fed remain unchanged. According to the CME FedWatch tool, markets have priced in a 25 basis point (bps) hike on Wednesday but aren’t sure about the next steps after July. In that sense, the messaging from the monetary policy statement and Jerome Powell’s stance will set the pace of the bond markets fuelling volatility on the non-yielding metals.
If the buyers consolidate above the 100-day Simple Moving Average (SMA), the technical outlook for the XAU/USD will be bright. The Relative Strength Index (RSI) stands in positive territory, pointing north, while the Moving Average Convergence Divergence (MACD) prints green bars suggesting that the bulls are gaining strength.
Resistance levels: $1,970, $1,980, $1,990.
Support levels: $1,965 (100-day SMA), $1,940, $1,900.
Technical Levels: Supports and Resistances
XAUUSD currently trading at 1964.92 at the time of writing. Pair opened at 1954.7 and is trading with a change of 0.52 % .
| Overview | Overview.1 | |
|---|---|---|
| 0 | Today last price | 1964.92 |
| 1 | Today Daily Change | 10.22 |
| 2 | Today Daily Change % | 0.52 |
| 3 | Today daily open | 1954.70 |
The pair remains strongly bullish on the daily timeframe. It trades above its 20 SMA @ 1938.72, 50 SMA 1947.88, 100 SMA @ 1961.77 and 200 SMA @ 1881.32.
| Trends | Trends.1 | |
|---|---|---|
| 0 | Daily SMA20 | 1938.72 |
| 1 | Daily SMA50 | 1947.88 |
| 2 | Daily SMA100 | 1961.77 |
| 3 | Daily SMA200 | 1881.32 |
The previous day high was 1967.94 while the previous day low was 1953.53. The daily 38.2% Fib levels comes at 1959.03, expected to provide support. Similarly, the daily 61.8% fib level is at 1962.44, expected to provide support.
Note the levels of interest below:
- Pivot support is noted at 1949.51, 1944.31, 1935.1
- Pivot resistance is noted at 1963.92, 1973.13, 1978.33
| Levels | Levels.1 |
|---|---|
| Previous Daily High | 1967.94 |
| Previous Daily Low | 1953.53 |
| Previous Weekly High | 1987.54 |
| Previous Weekly Low | 1945.85 |
| Previous Monthly High | 1983.50 |
| Previous Monthly Low | 1893.01 |
| Daily Fibonacci 38.2% | 1959.03 |
| Daily Fibonacci 61.8% | 1962.44 |
| Daily Pivot Point S1 | 1949.51 |
| Daily Pivot Point S2 | 1944.31 |
| Daily Pivot Point S3 | 1935.10 |
| Daily Pivot Point R1 | 1963.92 |
| Daily Pivot Point R2 | 1973.13 |
| Daily Pivot Point R3 | 1978.33 |
[/s2If]
Download Nehcap EAWe have two EAs that are operational on our LIVE accounts.
- EA-FIX: Check out the details here. Download EA-FIX . EA-FIX is a non-grid HFT scalper.
- EA-GROWTH: High quality low dd EA using trend grids. Download EA_GROWTHJoin Our Telegram Group
")


