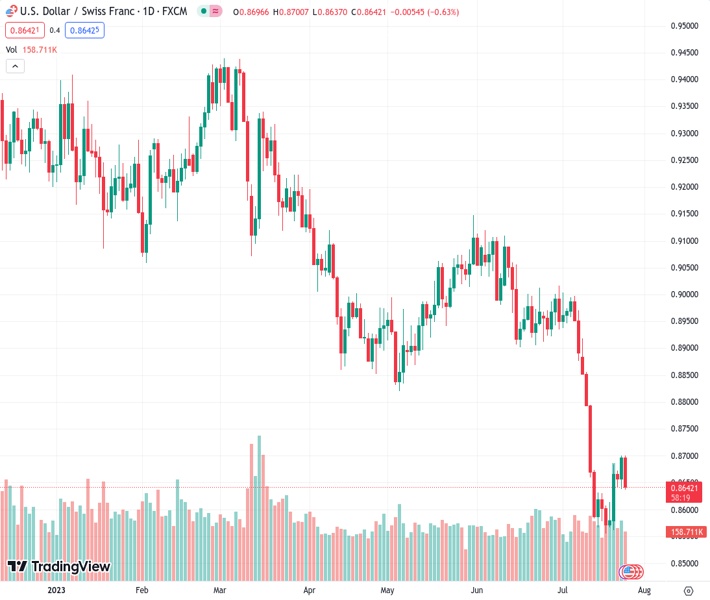
The downtrend of USDCHF at 0.86450 is still continuing, and the easiest direction for the currency pair is downwards, as long as it stays below the 61.8% Fibonacci retracement level of 0.8819.
…
This is a premium post.
[s2If !current_user_can(access_s2member_level4)]Please register for FREE REGISTER to read full post below containing analysis. In case of any error or you think you are not able to read the full post below, please email us at support#nehcap.com [lwa][/s2If] [s2If current_user_can(access_s2member_level1)]
- The USD/CHF downtrend remains intact, with a path of least resistance downwards as long as it remains below the 61.8% Fibonacci retracement level at 0.8819.
The pair currently trades last at 0.86450.
The previous day high was 0.87 while the previous day low was 0.8638. The daily 38.2% Fib levels comes at 0.8676, expected to provide resistance. Similarly, the daily 61.8% fib level is at 0.8661, expected to provide resistance.
USD/CHF retreats after reaching a daily high of 0.8700 and drops to a new two-day low amid a risk-on mood ahead of the US Federal Reserve (Fed) monetary policy decision. At the time of writing, the USD/CHF exchanges hands at 0.8640, down 0.59%.
The USD/CHF downtrend remains intact as long as the exchange rate stays below the May 4 daily low of 0.8819, confluence with the 61.8% Fibonacci (Fibo) retracement. Once that level is broken, the next resistance will emerge at the next confluence of the 50-day EMA and the 78.6% Fibo level at the 0.8875/0.8900 area, followed by the 0.9000 mark.
Nonetheless, the USD/CHF path of least resistance is downwards, as it resumed its fall to a fresh two-day low, past the 23.6% Fibo retracement at 0.8659. The following support emerges at the 0.8600 figure, and if sellers gather momentum, it could extend and test the year-to-date (YTD) low of 0.8554.
From an oscillator standpoint, the Relative Strength Index (RSI) aimed downward as the USD/CHF downtrend resumed, while the three-day Rate of Change (RoC) portrays sellers’ entering the market.
Technical Levels: Supports and Resistances
USDCHF currently trading at 0.8644 at the time of writing. Pair opened at 0.8697 and is trading with a change of -0.61 % .
| Overview | Overview.1 | |
|---|---|---|
| 0 | Today last price | 0.8644 |
| 1 | Today Daily Change | -0.0053 |
| 2 | Today Daily Change % | -0.6100 |
| 3 | Today daily open | 0.8697 |
The pair remains strongly bearish on the daily time frame. It trades below the 20 SMA @ 0.8797, 50 SMA 0.8929, 100 SMA @ 0.8996 and 200 SMA @ 0.9212.
| Trends | Trends.1 | |
|---|---|---|
| 0 | Daily SMA20 | 0.8797 |
| 1 | Daily SMA50 | 0.8929 |
| 2 | Daily SMA100 | 0.8996 |
| 3 | Daily SMA200 | 0.9212 |
The previous day high was 0.87 while the previous day low was 0.8638. The daily 38.2% Fib levels comes at 0.8676, expected to provide resistance. Similarly, the daily 61.8% fib level is at 0.8661, expected to provide resistance.
Note the levels of interest below:
- Pivot support is noted at 0.8656, 0.8616, 0.8594
- Pivot resistance is noted at 0.8719, 0.8741, 0.8781
| Levels | Levels.1 |
|---|---|
| Previous Daily High | 0.8700 |
| Previous Daily Low | 0.8638 |
| Previous Weekly High | 0.8684 |
| Previous Weekly Low | 0.8555 |
| Previous Monthly High | 0.9120 |
| Previous Monthly Low | 0.8902 |
| Daily Fibonacci 38.2% | 0.8676 |
| Daily Fibonacci 61.8% | 0.8661 |
| Daily Pivot Point S1 | 0.8656 |
| Daily Pivot Point S2 | 0.8616 |
| Daily Pivot Point S3 | 0.8594 |
| Daily Pivot Point R1 | 0.8719 |
| Daily Pivot Point R2 | 0.8741 |
| Daily Pivot Point R3 | 0.8781 |
[/s2If]
Download Nehcap EAWe have two EAs that are operational on our LIVE accounts.
- EA-FIX: Check out the details here. Download EA-FIX . EA-FIX is a non-grid HFT scalper.
- EA-GROWTH: High quality low dd EA using trend grids. Download EA_GROWTHJoin Our Telegram Group
")


