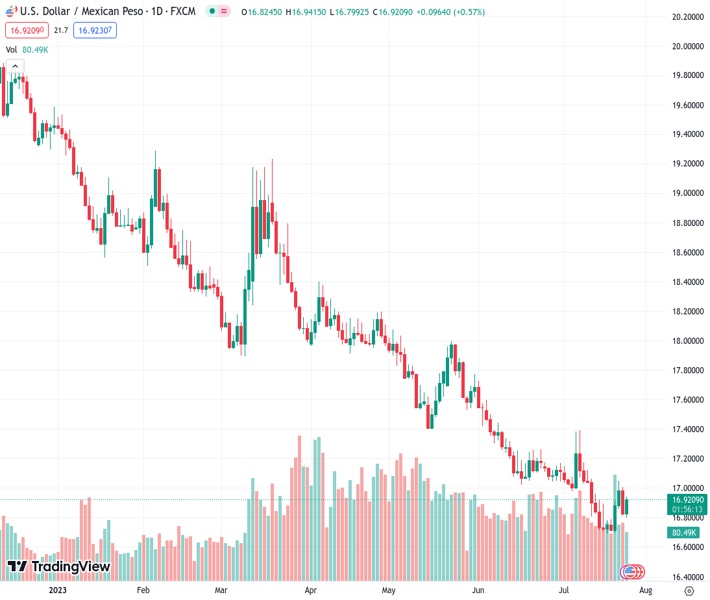
The USDMXN currency pair at a rate of 16.9208 has recovered from its lowest point of the week and has increased by 0.56%, indicating a positive movement in anticipation of the upcoming Federal Reserve interest rate decision.
…
This is a premium post.
[s2If !current_user_can(access_s2member_level4)]Please register for FREE REGISTER to read full post below containing analysis. In case of any error or you think you are not able to read the full post below, please email us at support#nehcap.com [lwa][/s2If] [s2If current_user_can(access_s2member_level1)]
- USD/MXN bounces back from weekly lows, gaining 0.56% ahead of the anticipated Fed rate decision.
The pair currently trades last at 16.9208.
The previous day high was 17.0097 while the previous day low was 16.8129. The daily 38.2% Fib levels comes at 16.888, expected to provide support. Similarly, the daily 61.8% fib level is at 16.9345, expected to provide resistance.
USD/MXN sustains losses after bouncing from weekly lows of 16.7992 due to a risk-on impulse. Simultaneously, traders brace for the US Federal Reserve (Fed) decision on Wednesday, which is expected to deliver another rate hike amid speculations its job is almost done. The USD/MXN is trading at 16.9188, gaining 0.56%.
US equities continued to trade in the green before the Fed’s decision. A measure of Consumer Confidence rose to a two-year high in July, as revealed by the Conference Board (CB), with the index coming at 117 from 110.1 in June, exceeding estimates of 111.8. Although it’s a positive sign, consumers’ perceptions of a recession increased over the following 12 months. Concurrently, other data showed that House Prices in the US climbed 2.8% YoY, its lowest since April 2012.
Meanwhile, the Richmond Fed revealed its Manufacturing Index, plunging to -9 from June’s -8, portraying a dismal outlook as shipments and new orders plummeted.
Despite mixed US data, market participants expect the Fed to hike 25 bps the Federal Funds Rate (FFR), but uncertainty arises about another increase, as said by some Fed policymakers ahead of their blackout period. Even so, the FOMC’s statement would provide the base for policy, and USD/MXN traders’ focus would remain on Fed Chair Powell’s press conference, which could give some clues regarding the future of monetary policy.
Another reason that acted as a tailwind for the USD/MXN is a strong US Dollar (USD), as depicted by the US Dollar Index (DXY). The DXY, which measures the USD performance against a basket of currencies, is almost flat at 101.375.
Across the south border, the Mexican economic docket revealed that Economic Activity stalled in May at 0% MoM, below 0.4% estimates, trailing April’s 0.9% expansion. Still annually based, the economy grew 4.3% in May in unadjusted terms, above April’s 2.7%.
The International Monetary Fund (IMF) recently updated Mexico’s 2023 growth forecasts from 1.8% in April to 2.6% in July.
The USD/MXN trend remains down, as shown by the daily chart. Although the USD/MXN bounced from yearly lows, the 20-day Exponential Moving Average (EMA) at 16.9530 is capping any upside attempts to lift the spot above the 17.00 figure, as the 20-day EMA is tracking price action closely, acting as a dynamic resistance. However, if USD/MXN buyers step in once they clear the 20-day EMA, that would expose the weekly high of 17.0500. A breach of the latter will expose the 50-day EMA at 17.2145, followed by May 17 low-turned resistance at 17.4038, ahead of the 100-day EMA at 17.6202. Failure to break initial resistance at the 20-day EMA, the USD/MXN could challenge the YTD low of 16.6899, ahead of dropping to 16.50.
Technical Levels: Supports and Resistances
USDMXN currently trading at 16.9176 at the time of writing. Pair opened at 16.8303 and is trading with a change of 0.52 % .
| Overview | Overview.1 | |
|---|---|---|
| 0 | Today last price | 16.9176 |
| 1 | Today Daily Change | 0.0873 |
| 2 | Today Daily Change % | 0.5200 |
| 3 | Today daily open | 16.8303 |
The pair remains strongly bearish on the daily time frame. It trades below the 20 SMA @ 16.9708, 50 SMA 17.2566, 100 SMA @ 17.7063 and 200 SMA @ 18.4506.
| Trends | Trends.1 | |
|---|---|---|
| 0 | Daily SMA20 | 16.9708 |
| 1 | Daily SMA50 | 17.2566 |
| 2 | Daily SMA100 | 17.7063 |
| 3 | Daily SMA200 | 18.4506 |
The previous day high was 17.0097 while the previous day low was 16.8129. The daily 38.2% Fib levels comes at 16.888, expected to provide support. Similarly, the daily 61.8% fib level is at 16.9345, expected to provide resistance.
Note the levels of interest below:
- Pivot support is noted at 16.7589, 16.6875, 16.5621
- Pivot resistance is noted at 16.9557, 17.0811, 17.1525
| Levels | Levels.1 |
|---|---|
| Previous Daily High | 17.0097 |
| Previous Daily Low | 16.8129 |
| Previous Weekly High | 17.0512 |
| Previous Weekly Low | 16.6924 |
| Previous Monthly High | 17.7286 |
| Previous Monthly Low | 17.0243 |
| Daily Fibonacci 38.2% | 16.8880 |
| Daily Fibonacci 61.8% | 16.9345 |
| Daily Pivot Point S1 | 16.7589 |
| Daily Pivot Point S2 | 16.6875 |
| Daily Pivot Point S3 | 16.5621 |
| Daily Pivot Point R1 | 16.9557 |
| Daily Pivot Point R2 | 17.0811 |
| Daily Pivot Point R3 | 17.1525 |
[/s2If]
Download Nehcap EAWe have two EAs that are operational on our LIVE accounts.
- EA-FIX: Check out the details here. Download EA-FIX . EA-FIX is a non-grid HFT scalper.
- EA-GROWTH: High quality low dd EA using trend grids. Download EA_GROWTHJoin Our Telegram Group
")


