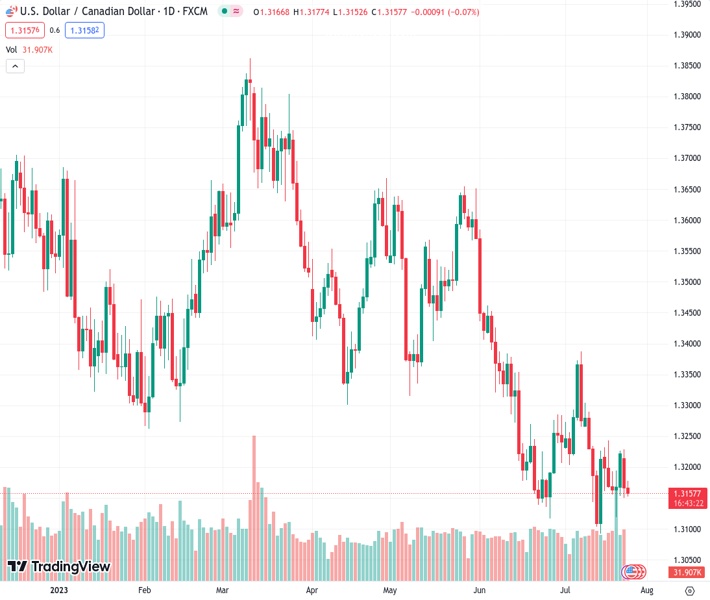
On Tuesday, the USDCAD pair had a slight downward trend for the second day in a row, trading at a price of 1.31568.
…
This is a premium post.
[s2If !current_user_can(access_s2member_level4)]Please register for FREE REGISTER to read full post below containing analysis. In case of any error or you think you are not able to read the full post below, please email us at support#nehcap.com [lwa][/s2If] [s2If current_user_can(access_s2member_level1)]
- USD/CAD trades with a mild negative bias for the second successive day on Tuesday.
The pair currently trades last at 1.31568.
The previous day high was 1.3229 while the previous day low was 1.315. The daily 38.2% Fib levels comes at 1.318, expected to provide resistance. Similarly, the daily 61.8% fib level is at 1.3199, expected to provide resistance.
The USD/CAD pair remains on the defensive for the second successive day on Tuesday and hits a three-day low, around the 1.3150 region during the Asian session.
Crude Oil prices consolidate the recent strong gains to over a three-month high touched on Monday and remain well supported by hopes that more stimulus from China – the world’s largest oil importer – will boost fuel demand. Apart from this, expectations for tighter global supply act as a tailwind for the black liquid, which, in turn, is seen underpinning the commodity-linked Loonie and acting as a headwind for the USD/CAD pair.
The US Dollar (USD), on the other hand, pulls back from a two-week high and for now, seems to have stalled the recent recovery move from the lowest level since April 2022, witnessed over the past week or so. This is seen as another factor exerting some pressure on the USD/CAD pair, though the lack of strong follow-through selling warrants some cation before placing aggressive bearish bets and positioning for further losses.
Traders might prefer to move to the sidelines and wait for fresh cues about the Federal Reserve’s (Fed) future rate-hike path. It is worth recalling that the markets have been pricing out the possibility of any further interest rate hikes after the expected 25 bps lift-off at the end of a two-day FOMC meeting on Wednesday. Hence, the focus remains on the accompanying policy statement and Fed Chair Jerome Powell’s remarks at the post-meeting press conference.
The Fed’s policy outlook will play a key role in driving the USD demand in the near term and provide a fresh directional impetus to the USD/CAD pair. In the meantime, traders on Tuesday will take cues from the release of the Conference Board’s US Consumer Sentiment Index and Richmond Manufacturing Index. This week’s US economic docket also features the Advance Q2 GDP print and the Core PCE Price Index – the Fed’s preferred inflation gauge.
Apart from this, Oil price dynamics might further contribute to producing some meaningful trading opportunities around the USD/CAD pair. The aforementioned fundamental backdrop, meanwhile, makes it prudent to wait for strong follow-through selling and a sustained break/acceptance below the 1.3100 mark to support prospects for the resumption of the downward trajectory from the YTD peak touched in March.
Technical Levels: Supports and Resistances
USDCAD currently trading at 1.3155 at the time of writing. Pair opened at 1.3168 and is trading with a change of -0.1 % .
| Overview | Overview.1 | |
|---|---|---|
| 0 | Today last price | 1.3155 |
| 1 | Today Daily Change | -0.0013 |
| 2 | Today Daily Change % | -0.1000 |
| 3 | Today daily open | 1.3168 |
The pair remains strongly bearish on the daily time frame. It trades below the 20 SMA @ 1.3223, 50 SMA 1.3327, 100 SMA @ 1.3447 and 200 SMA @ 1.3474.
| Trends | Trends.1 | |
|---|---|---|
| 0 | Daily SMA20 | 1.3223 |
| 1 | Daily SMA50 | 1.3327 |
| 2 | Daily SMA100 | 1.3447 |
| 3 | Daily SMA200 | 1.3474 |
The previous day high was 1.3229 while the previous day low was 1.315. The daily 38.2% Fib levels comes at 1.318, expected to provide resistance. Similarly, the daily 61.8% fib level is at 1.3199, expected to provide resistance.
Note the levels of interest below:
- Pivot support is noted at 1.3136, 1.3104, 1.3057
- Pivot resistance is noted at 1.3214, 1.3261, 1.3293
| Levels | Levels.1 |
|---|---|
| Previous Daily High | 1.3229 |
| Previous Daily Low | 1.3150 |
| Previous Weekly High | 1.3244 |
| Previous Weekly Low | 1.3120 |
| Previous Monthly High | 1.3585 |
| Previous Monthly Low | 1.3117 |
| Daily Fibonacci 38.2% | 1.3180 |
| Daily Fibonacci 61.8% | 1.3199 |
| Daily Pivot Point S1 | 1.3136 |
| Daily Pivot Point S2 | 1.3104 |
| Daily Pivot Point S3 | 1.3057 |
| Daily Pivot Point R1 | 1.3214 |
| Daily Pivot Point R2 | 1.3261 |
| Daily Pivot Point R3 | 1.3293 |
[/s2If]
Download Nehcap EAWe have two EAs that are operational on our LIVE accounts.
- EA-FIX: Check out the details here. Download EA-FIX . EA-FIX is a non-grid HFT scalper.
- EA-GROWTH: High quality low dd EA using trend grids. Download EA_GROWTHJoin Our Telegram Group


