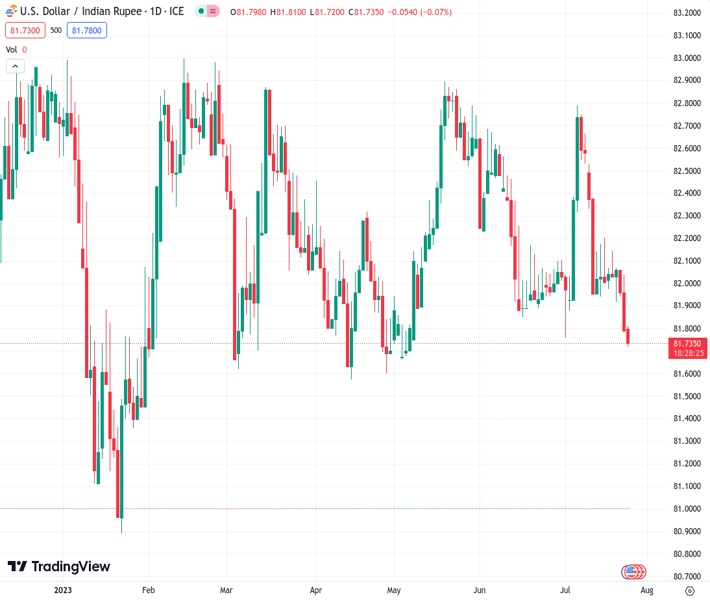
The exchange rate between the US dollar and the Indian rupee, currently at 81.7100, is declining and reaching a low that hasn’t been seen in multiple days. This marks the third consecutive day of losses.
…
This is a premium post.
[s2If !current_user_can(access_s2member_level4)]Please register for FREE REGISTER to read full post below containing analysis. In case of any error or you think you are not able to read the full post below, please email us at support#nehcap.com [lwa][/s2If] [s2If current_user_can(access_s2member_level1)]
- USD/INR takes offers to refresh multi-day low, prints three-day losing streak.
The pair currently trades last at 81.7100.
The previous day high was 82.052 while the previous day low was 81.7902. The daily 38.2% Fib levels comes at 81.8902, expected to provide resistance. Similarly, the daily 61.8% fib level is at 81.952, expected to provide resistance.
USD/INR stands on slippery grounds as it drops for the third consecutive day to test the lowest levels in nearly three months amid early Tuesday. In doing so, the Indian Rupee (INR) pair cheers the risk-on mood in Asia, as well as the US Dollar’s retreat, while declining to 81.73 by the press time.
Headlines fueling hopes of China stimulus and bank intervention from Beijing seem to underpin the latest optimism in the Asia-Pacific zone. While portraying the mood, stocks in China and Hong Kong rallied by nearly 3.0% on the day whereas the index of MSCI’s Asia-Pacific shares outside Japan also rise 1.50% intraday by the press time.
Apart from the China-inspired firmer sentiment, recently downbeat activity data from the major economies also propel the sentiment and weigh on the USD/INR pair amid concerns that the central banks are near the policy pivot.
That said, the US Dollar Index (DXY) retreats from a two-week high after cheering the comparatively better PMIs the previous day, down 0.12% intraday near 101.25 at the latest. It should be observed that the first readings of the US S&P Global Manufacturing PMI for July improved to 49.0 from 46.3 prior and 46.4 market forecasts while the Services PMI eased to 52.4 versus 54.0 expected and 54.4 previous readings. With this, the Composite PMI edged lower to 52.0 from 53.2 prior and 53.1 market forecasts. That said, Chicago Fed National Activity Index for June slid to -0.32 from -0.28 prior (revised) and 0.03 market forecasts.
Not only the US but downbeat PMIs from the rest of the major economies also allowed Wall Street to close on the positive side the previous day, as well as favored the US Treasury bond yields to refresh multi-day high. That said, the manufacturing activity data from Eurozone and Germany dropped to the lowest levels since 2020 while the PMIs from the UK, Australia and Japan were also suggesting fears of easy economic activities.
Against this backdrop, the S&P500 Futures remain sidelined near 4,580, struggling to extend the previous day’s recovery, whereas the US 10-year and two-year Treasury bond yields retreat from the highest levels in two weeks to 3.86% and 4.84% in that order.
To sum up, the upbeat risk profile propels the Indian Rupee (INR) but the US Dollar’s retreat appears elusive and hence today’s US CB Consumer Confidence for July, expected 112.1 versus 109.70 prior, and Wednesday’s Fed Chair Jerome Powell’s speech should be observed closely for clear directions.
A clear downside break of the 3.5-month-old rising support line, now immediate resistance around 81.85, directs the USD/INR price towards a horizontal area comprising multiple levels marked since February around 81.50.
Technical Levels: Supports and Resistances
USDINR currently trading at 81.7364 at the time of writing. Pair opened at 81.827 and is trading with a change of -0.11% % .
| Overview | Overview.1 | |
|---|---|---|
| 0 | Today last price | 81.7364 |
| 1 | Today Daily Change | -0.0906 |
| 2 | Today Daily Change % | -0.11% |
| 3 | Today daily open | 81.827 |
The pair remains strongly bearish on the daily time frame. It trades below the 20 SMA @ 82.17, 50 SMA 82.2992, 100 SMA @ 82.193 and 200 SMA @ 82.1717.
| Trends | Trends.1 | |
|---|---|---|
| 0 | Daily SMA20 | 82.1700 |
| 1 | Daily SMA50 | 82.2992 |
| 2 | Daily SMA100 | 82.1930 |
| 3 | Daily SMA200 | 82.1717 |
The previous day high was 82.052 while the previous day low was 81.7902. The daily 38.2% Fib levels comes at 81.8902, expected to provide resistance. Similarly, the daily 61.8% fib level is at 81.952, expected to provide resistance.
Note the levels of interest below:
- Pivot support is noted at 81.7275, 81.6279, 81.4656
- Pivot resistance is noted at 81.9893, 82.1516, 82.2512
| Levels | Levels.1 |
|---|---|
| Previous Daily High | 82.0520 |
| Previous Daily Low | 81.7902 |
| Previous Weekly High | 82.2014 |
| Previous Weekly Low | 81.9116 |
| Previous Monthly High | 82.7370 |
| Previous Monthly Low | 81.8477 |
| Daily Fibonacci 38.2% | 81.8902 |
| Daily Fibonacci 61.8% | 81.9520 |
| Daily Pivot Point S1 | 81.7275 |
| Daily Pivot Point S2 | 81.6279 |
| Daily Pivot Point S3 | 81.4656 |
| Daily Pivot Point R1 | 81.9893 |
| Daily Pivot Point R2 | 82.1516 |
| Daily Pivot Point R3 | 82.2512 |
[/s2If]
Download Nehcap EAWe have two EAs that are operational on our LIVE accounts.
- EA-FIX: Check out the details here. Download EA-FIX . EA-FIX is a non-grid HFT scalper.
- EA-GROWTH: High quality low dd EA using trend grids. Download EA_GROWTHJoin Our Telegram Group


