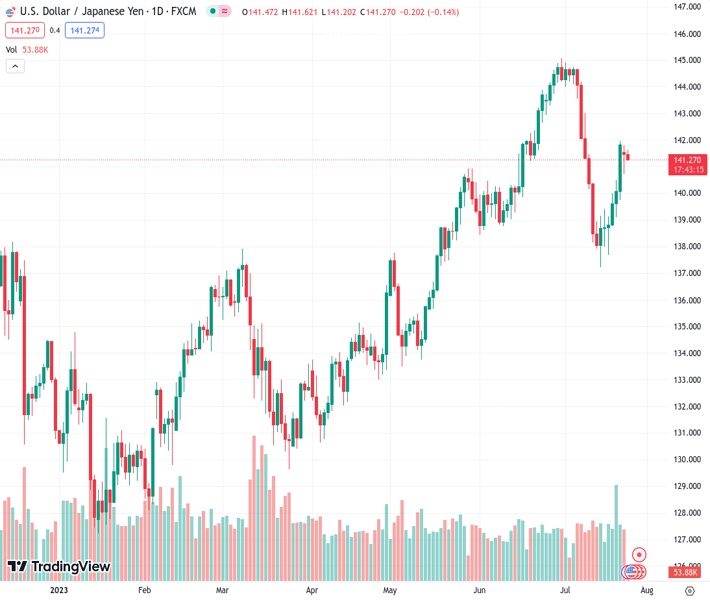
There are offers to continue the decline of the USDJPY currency pair from its recent high of 141.253. According to Nehcap, the downside potential is expected to be limited.
…
This is a premium post.
[s2If !current_user_can(access_s2member_level4)]Please register for FREE REGISTER to read full post below containing analysis. In case of any error or you think you are not able to read the full post below, please email us at support#nehcap.com [lwa][/s2If] [s2If current_user_can(access_s2member_level1)]
- USD/JPY takes offers to extend the previous day’s retreat from two-week high.
The pair currently trades last at 141.253.
The previous day high was 141.82 while the previous day low was 140.74. The daily 38.2% Fib levels comes at 141.15, expected to provide support. Similarly, the daily 61.8% fib level is at 141.41, expected to provide resistance.
USD/JPY remains on the back foot for the second consecutive day, down 0.15% intraday near 141.25 by the press time, as the risk-on mood in Asia weighs on the US Dollar of late. Even so, the key technical supports and cautious mood ahead of this week’s monetary policy meetings of the US Federal Reserve and the Bank of Japan (BoJ) prod the Yen pair sellers.
Also read: S&P500 Futures struggle to justify optimism in China, Hong Kong amid sluggish yields, pre-Fed anxiety
That said, the RSI (14) line’s retreat from the overbought territory joins the impending bear cross on the MACD indicator to also weigh on the USD/JPY price.
However, a two-month-old horizontal support area surrounding the 141.00 round figure restricts the immediate downside of the Yen pair.
Even if the quote drops back below the 141.00 support, a convergence of the 100 and 200 Exponential Moving Average (EMA), around 140.80 at the latest, appears a tough nut to crack for the USD/JPY bears to conquer.
It’s worth mentioning that a fortnight-long rising support line near 140.55 acts as the last defense of the USD/JPY bulls.
On the flip side, the latest peak of 141.95 and the 61.8% Fibonacci retracement of the pair’s June 30 to July 14 downside, near 142.05, can challenge the USD/JPY pair’s recovery moves.
Following that, the July 10 swing high of around 143.00 can test the Yen pair buyers before directing them to the monthly top of near 145.00.
Trend: Limited downside expected
Technical Levels: Supports and Resistances
USDJPY currently trading at 141.23 at the time of writing. Pair opened at 141.48 and is trading with a change of -0.18% % .
| Overview | Overview.1 | |
|---|---|---|
| 0 | Today last price | 141.23 |
| 1 | Today Daily Change | -0.25 |
| 2 | Today Daily Change % | -0.18% |
| 3 | Today daily open | 141.48 |
The pair is trading below its 20 Daily moving average @ 141.76, above its 50 Daily moving average @ 140.74 , above its 100 Daily moving average @ 137.25 and above its 200 Daily moving average @ 136.88
| Trends | Trends.1 | |
|---|---|---|
| 0 | Daily SMA20 | 141.76 |
| 1 | Daily SMA50 | 140.74 |
| 2 | Daily SMA100 | 137.25 |
| 3 | Daily SMA200 | 136.88 |
The previous day high was 141.82 while the previous day low was 140.74. The daily 38.2% Fib levels comes at 141.15, expected to provide support. Similarly, the daily 61.8% fib level is at 141.41, expected to provide resistance.
Note the levels of interest below:
- Pivot support is noted at 140.88, 140.27, 139.8
- Pivot resistance is noted at 141.95, 142.42, 143.02
| Levels | Levels.1 |
|---|---|
| Previous Daily High | 141.82 |
| Previous Daily Low | 140.74 |
| Previous Weekly High | 141.96 |
| Previous Weekly Low | 137.68 |
| Previous Monthly High | 145.07 |
| Previous Monthly Low | 138.43 |
| Daily Fibonacci 38.2% | 141.15 |
| Daily Fibonacci 61.8% | 141.41 |
| Daily Pivot Point S1 | 140.88 |
| Daily Pivot Point S2 | 140.27 |
| Daily Pivot Point S3 | 139.80 |
| Daily Pivot Point R1 | 141.95 |
| Daily Pivot Point R2 | 142.42 |
| Daily Pivot Point R3 | 143.02 |
[/s2If]
Download Nehcap EAWe have two EAs that are operational on our LIVE accounts.
- EA-FIX: Check out the details here. Download EA-FIX . EA-FIX is a non-grid HFT scalper.
- EA-GROWTH: High quality low dd EA using trend grids. Download EA_GROWTHJoin Our Telegram Group


