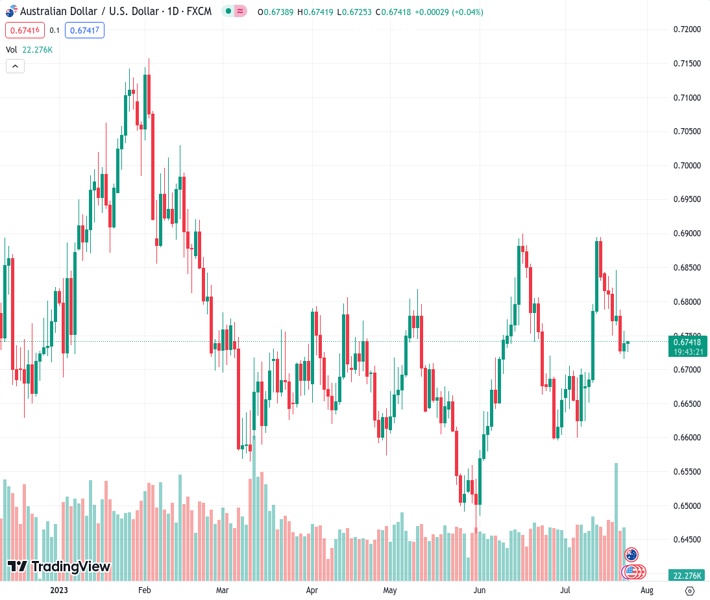
The AUDUSD pair, currently at 0.67397, is losing momentum after a slight recovery from the 0.6720 support level due to negative signals in the options market. The viewpoint of @nehcap suggests that there is not much room for further decline.
…
This is a premium post.
[s2If !current_user_can(access_s2member_level4)]Please register for FREE REGISTER to read full post below containing analysis. In case of any error or you think you are not able to read the full post below, please email us at support#nehcap.com [lwa][/s2If] [s2If current_user_can(access_s2member_level1)]
- The pair currently trades last at 0.67397.
- Pivot support is noted at 0.6718, 0.6696, 0.6676
- Pivot resistance is noted at 0.6759, 0.6778, 0.68
- EA-FIX: Check out the details here. Download EA-FIX . EA-FIX is a non-grid HFT scalper.
- EA-GROWTH: High quality low dd EA using trend grids. Download EA_GROWTHJoin Our Telegram Group
The previous day high was 0.6756 while the previous day low was 0.6715. The daily 38.2% Fib levels comes at 0.674, expected to provide resistance. Similarly, the daily 61.8% fib level is at 0.6731, expected to provide support.
AUD/USD clings to mild losses around 0.6730 as it reverses the previous day’s corrective bounce off the two-week low amid the mid-Asian session on Tuesday. In doing so, the Aussie pair fades recovery from the 200-DMA support of around 0.6720 amid bearish signals from the options market.
That said, the one-month Risk Reversal (RR) of the AUD/USD pair, a measure of the spread between call and put prices, dropped for the fourth consecutive day to -0.033 by the end of Monday’s North American trading session.
With this, the Aussie RR extends the previous week’s bearish bias, as portrayed by the weekly RR of -0.195, the biggest in three months, amid the market’s cautious mood and the broadly firmer US Dollar.
Also read: AUD/USD ignores firmer US Dollar to recover from two-week low above 0.6700 amid risk-on mood
Technically, AUD/USD retreats from a one-week-old descending resistance line, around 0.6750 by the press time, as the MACD indicator prints the first daily negative in two weeks. Adding strength to the downside bias is the steady RSI (14) line.
However, a convergence of the 200-DMA and 21-DMA, around 0.6720 by the press time, restricts the immediate downside of the AUD/USD pair, a break of which can drag the quote towards a two-month-old rising support line, close to 0.6690 at the latest.
Overall, AUD/USD appears stuck between the key trend lines while the DMA confluence tests the bears.
Trend: Limited downside expected
Technical Levels: Supports and Resistances
AUDUSD currently trading at 0.6732 at the time of writing. Pair opened at 0.6739 and is trading with a change of -0.10% % .
| Overview | Overview.1 | |
|---|---|---|
| 0 | Today last price | 0.6732 |
| 1 | Today Daily Change | -0.0007 |
| 2 | Today Daily Change % | -0.10% |
| 3 | Today daily open | 0.6739 |
The pair remains strongly bullish on the daily timeframe. It trades above its 20 SMA @ 0.6721, 50 SMA 0.6692, 100 SMA @ 0.6687 and 200 SMA @ 0.672.
| Trends | Trends.1 | |
|---|---|---|
| 0 | Daily SMA20 | 0.6721 |
| 1 | Daily SMA50 | 0.6692 |
| 2 | Daily SMA100 | 0.6687 |
| 3 | Daily SMA200 | 0.6720 |
The previous day high was 0.6756 while the previous day low was 0.6715. The daily 38.2% Fib levels comes at 0.674, expected to provide resistance. Similarly, the daily 61.8% fib level is at 0.6731, expected to provide support.
Note the levels of interest below:
| Levels | Levels.1 |
|---|---|
| Previous Daily High | 0.6756 |
| Previous Daily Low | 0.6715 |
| Previous Weekly High | 0.6854 |
| Previous Weekly Low | 0.6722 |
| Previous Monthly High | 0.6900 |
| Previous Monthly Low | 0.6484 |
| Daily Fibonacci 38.2% | 0.6740 |
| Daily Fibonacci 61.8% | 0.6731 |
| Daily Pivot Point S1 | 0.6718 |
| Daily Pivot Point S2 | 0.6696 |
| Daily Pivot Point S3 | 0.6676 |
| Daily Pivot Point R1 | 0.6759 |
| Daily Pivot Point R2 | 0.6778 |
| Daily Pivot Point R3 | 0.6800 |
[/s2If]
Download Nehcap EAWe have two EAs that are operational on our LIVE accounts.


