Silver price remains at a low point for the past two weeks following a three-day period of losses. The viewpoint of @nehcap suggests that there is a likelihood of the price decreasing even further.
…
This is a premium post.
[s2If !current_user_can(access_s2member_level4)]Please register for FREE REGISTER to read full post below containing analysis. In case of any error or you think you are not able to read the full post below, please email us at support#nehcap.com [lwa][/s2If] [s2If current_user_can(access_s2member_level1)]
- Silver Price stays depressed at two-week low after three-day losing streak.
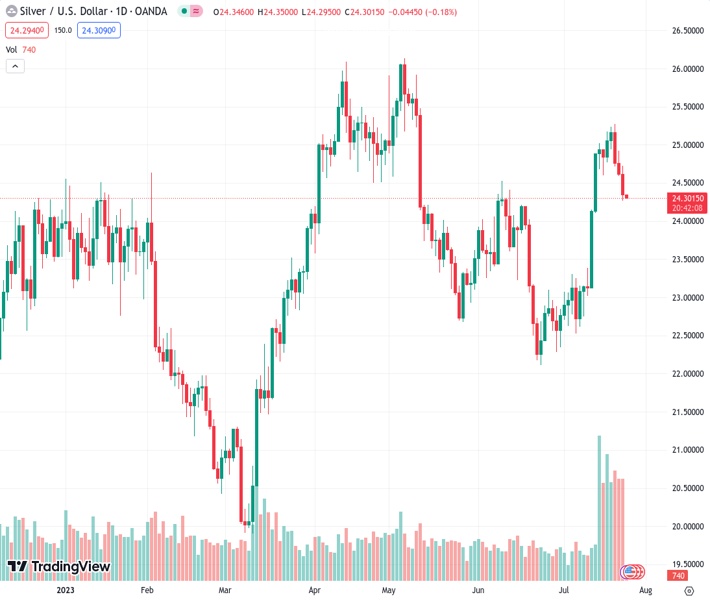
The pair currently trades last at 24.301.
The previous day high was 24.73 while the previous day low was 24.26. The daily 38.2% Fib levels comes at 24.44, expected to provide resistance. Similarly, the daily 61.8% fib level is at 24.55, expected to provide resistance.
Silver Price (XAG/USD) remains on the back foot at the lowest levels in two weeks despite making rounds to $24.30 amid Tuesday’s Asian session. In doing so, the XAG/USD justifies the oversold RSI (14) line as bears take a breather after the commodities decline in the last three consecutive days.
Although the RSI conditions test the Silver sellers, a clear downside break of the 13-day-old ascending trend line and the bearish MACD signals suggest further downside of the precious metal. The same highlights 50% Fibonacci retracement of the quote’s May-June downside, near $24.10.
However, a convergence of the 200-SMA and 38.2% Fibonacci retracement, at $23.65 by the press time, appears a tough nut to crack for the XAG/USD bears afterward.
In a case where the Silver Price remains bearish past $23.65, an upward-sloping support line from June 23, close to $23.30 at the latest, will act as the final defense of the XAG/USD buyers.
On the flip side, XAG/USD recovery needs validation from the previous support line and the 61.8% Fibonacci retracement, respectively around $24.45 and $24.60, to convince buyers.
Even so, the $25.00 round figure and the latest peak of around $25.30 could check the upside momentum before fueling the Silver Price toward the double tops marked in April and May around $26.15.
Trend: Further downside expected
Technical Levels: Supports and Resistances
XAGUSD currently trading at 24.31 at the time of writing. Pair opened at 24.35 and is trading with a change of -0.16% % .
| Overview | Overview.1 | |
|---|---|---|
| 0 | Today last price | 24.31 |
| 1 | Today Daily Change | -0.04 |
| 2 | Today Daily Change % | -0.16% |
| 3 | Today daily open | 24.35 |
The pair remains strongly bullish on the daily timeframe. It trades above its 20 SMA @ 23.73, 50 SMA 23.59, 100 SMA @ 23.76 and 200 SMA @ 22.94.
| Trends | Trends.1 | |
|---|---|---|
| 0 | Daily SMA20 | 23.73 |
| 1 | Daily SMA50 | 23.59 |
| 2 | Daily SMA100 | 23.76 |
| 3 | Daily SMA200 | 22.94 |
The previous day high was 24.73 while the previous day low was 24.26. The daily 38.2% Fib levels comes at 24.44, expected to provide resistance. Similarly, the daily 61.8% fib level is at 24.55, expected to provide resistance.
Note the levels of interest below:
- Pivot support is noted at 24.17, 23.98, 23.7
- Pivot resistance is noted at 24.63, 24.91, 25.09
| Levels | Levels.1 |
|---|---|
| Previous Daily High | 24.73 |
| Previous Daily Low | 24.26 |
| Previous Weekly High | 25.27 |
| Previous Weekly Low | 24.59 |
| Previous Monthly High | 24.53 |
| Previous Monthly Low | 22.11 |
| Daily Fibonacci 38.2% | 24.44 |
| Daily Fibonacci 61.8% | 24.55 |
| Daily Pivot Point S1 | 24.17 |
| Daily Pivot Point S2 | 23.98 |
| Daily Pivot Point S3 | 23.70 |
| Daily Pivot Point R1 | 24.63 |
| Daily Pivot Point R2 | 24.91 |
| Daily Pivot Point R3 | 25.09 |
[/s2If]
Download Nehcap EAWe have two EAs that are operational on our LIVE accounts.
- EA-FIX: Check out the details here. Download EA-FIX . EA-FIX is a non-grid HFT scalper.
- EA-GROWTH: High quality low dd EA using trend grids. Download EA_GROWTHJoin Our Telegram Group


