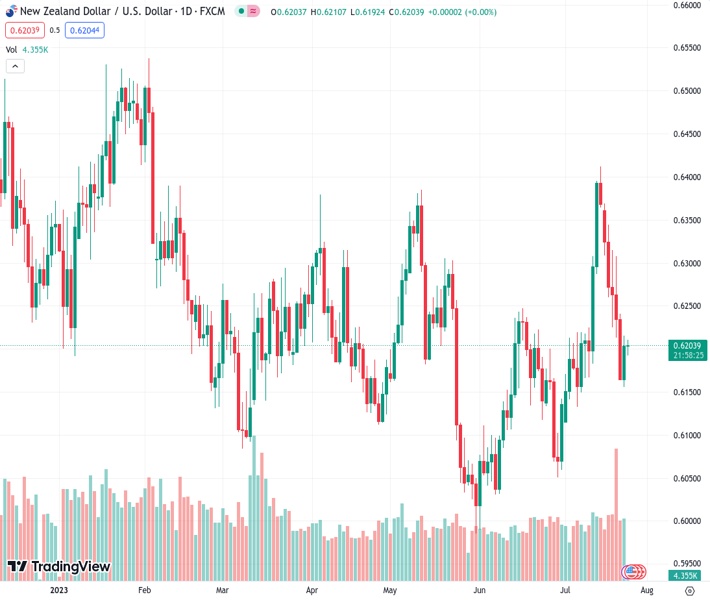
During the early Asian session on Tuesday, the NZDUSD currency pair is moving back and forth in a narrow range slightly above the 0.6200 level.
…
This is a premium post.
[s2If !current_user_can(access_s2member_level4)]Please register for FREE REGISTER to read full post below containing analysis. In case of any error or you think you are not able to read the full post below, please email us at support#nehcap.com [lwa][/s2If] [s2If current_user_can(access_s2member_level1)]
- NZD/USD oscillates in a range just above the 0.6200 area during the early Asian session on Tuesday.
The pair currently trades last at 0.62047.
The previous day high was 0.6242 while the previous day low was 0.6163. The daily 38.2% Fib levels comes at 0.6193, expected to provide support. Similarly, the daily 61.8% fib level is at 0.6212, expected to provide resistance.
The NZD/USD pair consolidates in a narrow range above the 0.6200 area in the early Asian session. The market seems cautious ahead of the Federal Open Market Committee (FOMC) meeting.
The US S&P Global Composite PMI for July showed weaker-than-expected data. The figure fell to 52 from 53.2, versus 53.1 expected. Meanwhile, the S&P Global Manufacturing PMI improved to 49 from 46.3, and the Services PMI declined to 52.4 from 54.4. The data failed to lift the US Dollar against the Kiwi (NZD), which gained momentum during the day.
The Federal Reserve (Fed) will announce the outcome of its monetary policy meeting on Wednesday. According to the CME Group FedWatch tool, it is widely anticipated that the Fed will increase interest rates by 25 basis points (bps) to 5.25–5.50%.
On Monday, Statistics New Zealand reported that New Zealand’s Trade Balance in June decreased to $9M MoM from $52M previously (revised). The annual trade deficit decreased to $15.98B for the same month from $-17.12B previously (revised from $-15.64B). Additionally, Exports for June declined to $6.31B compared to $6.97B (revised) previously, while imports fell to $6.3B from $6.91B prior.
A lack of economic data released from New Zealand later this week has left market participants taking cues from US and China developments. China’s top leaders signaled additional support for the real estate sector and a series of measures to stimulate consumption.
Market participants will keep an eye on the FOMC meeting and Fed Chairman Jerome Powell’s press conference. Apart from this, traders will take cues from US CB Consumer Confidence, Advance GDP QoQ, and the Fed’s preferred measure of inflation, the core Personal Consumption Expenditure (PCE) Price Index MoM. These events could significantly impact the US Dollar’s dynamic and give the NZD/USD pair a clear direction.
Technical Levels: Supports and Resistances
NZDUSD currently trading at 0.6204 at the time of writing. Pair opened at 0.6168 and is trading with a change of 0.58 % .
| Overview | Overview.1 | |
|---|---|---|
| 0 | Today last price | 0.6204 |
| 1 | Today Daily Change | 0.0036 |
| 2 | Today Daily Change % | 0.5800 |
| 3 | Today daily open | 0.6168 |
The pair is trading below its 20 Daily moving average @ 0.621, above its 50 Daily moving average @ 0.617 , above its 100 Daily moving average @ 0.6195 and below its 200 Daily moving average @ 0.6206
| Trends | Trends.1 | |
|---|---|---|
| 0 | Daily SMA20 | 0.6210 |
| 1 | Daily SMA50 | 0.6170 |
| 2 | Daily SMA100 | 0.6195 |
| 3 | Daily SMA200 | 0.6206 |
The previous day high was 0.6242 while the previous day low was 0.6163. The daily 38.2% Fib levels comes at 0.6193, expected to provide support. Similarly, the daily 61.8% fib level is at 0.6212, expected to provide resistance.
Note the levels of interest below:
- Pivot support is noted at 0.614, 0.6112, 0.6061
- Pivot resistance is noted at 0.6219, 0.627, 0.6298
| Levels | Levels.1 |
|---|---|
| Previous Daily High | 0.6242 |
| Previous Daily Low | 0.6163 |
| Previous Weekly High | 0.6370 |
| Previous Weekly Low | 0.6163 |
| Previous Monthly High | 0.6250 |
| Previous Monthly Low | 0.5990 |
| Daily Fibonacci 38.2% | 0.6193 |
| Daily Fibonacci 61.8% | 0.6212 |
| Daily Pivot Point S1 | 0.6140 |
| Daily Pivot Point S2 | 0.6112 |
| Daily Pivot Point S3 | 0.6061 |
| Daily Pivot Point R1 | 0.6219 |
| Daily Pivot Point R2 | 0.6270 |
| Daily Pivot Point R3 | 0.6298 |
[/s2If]
Download Nehcap EAWe have two EAs that are operational on our LIVE accounts.
- EA-FIX: Check out the details here. Download EA-FIX . EA-FIX is a non-grid HFT scalper.
- EA-GROWTH: High quality low dd EA using trend grids. Download EA_GROWTHJoin Our Telegram Group


