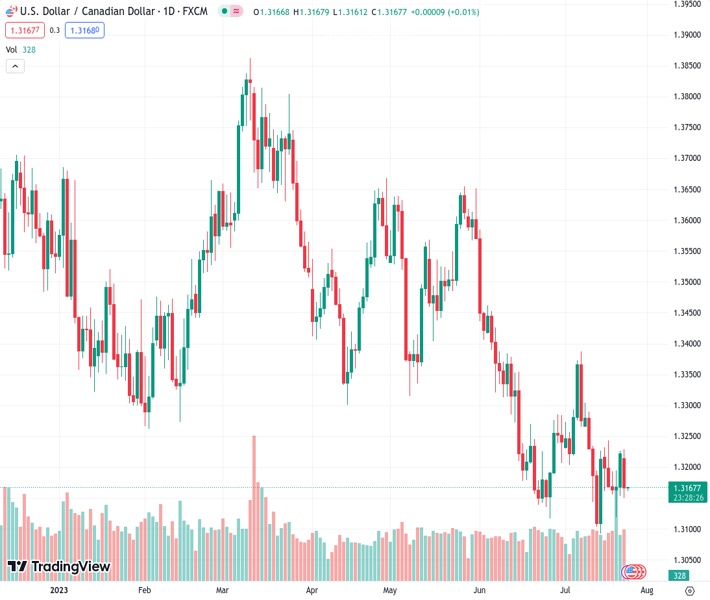
The USDCAD pair, trading at 1.31671, declined close to 1.3170 after the buyers were unable to regain control over the 20-day Simple Moving Average (SMA).
…
This is a premium post.
[s2If !current_user_can(access_s2member_level4)]Please register for FREE REGISTER to read full post below containing analysis. In case of any error or you think you are not able to read the full post below, please email us at support#nehcap.com [lwa][/s2If] [s2If current_user_can(access_s2member_level1)]
- USD/CAD fell towards 1.3170 as the bulls failed to reconquer the 20-day SMA.
The pair currently trades last at 1.31671.
The previous day high was 1.3226 while the previous day low was 1.3153. The daily 38.2% Fib levels comes at 1.3198, expected to provide resistance. Similarly, the daily 61.8% fib level is at 1.3181, expected to provide resistance.
On Monday, the USD/CAD declined towards 1.3170 despite the USD trading strong against most of its rivals. In that sense, the CAD managed to gain traction on the back of rising Oil prices as Canada is a producer. The focus now shifts to Wednesday’s Federal Reserve (Fed) decision.
On the data front, S&P Global released mixed data on the US economy. July’s Manufacturing PMI came in positive at 49, surpassing the expected 46.4 and the previous 46.3. On the other hand, July’s Services PMI reported 52.4, falling short of the higher consensus of 54 but still lower than the previous 54.4. Reacting to the data, the USD DXY traded with gains near the 101.40 area.
Regarding Wednesday’s Fed decision, markets have already priced in a 25 basis point (bps) hike, but the odds of a hike past July fell to near 20%, according to the CME FedWatch tool. In that sense, the Federal Open Market Committee’s (FOMC) monetary policy statement and Chair Powell’s words will be closely watched as investors look for clues regarding forward guidance.
In favour of the CAD, the decrease in operating oil rigs contributes to supply-side concerns and drives crude oil prices higher. Additionally, the expectations of economic stimulus in China (the world’s biggest Oil importer) support the black gold price, as the Chinese government has expressed its commitment to stimulate domestic demand and support the property sector.
The daily chart suggests a bearish outlook for the short-term USD/CAD. Bulls were rejected several times by the 20-day Simple Moving Average (SMA), signalling that the buyers struggle to gain momentum. In addition, technical indicators show weakness, with the Relative Strength Index (RSI) below 50.00 and the Moving Average Convergence Divergence (MACD) printing fading green bars.
Resistance Levels: 1.3222 (20-day SMA), 1.3240, 1.3250.
Supports Levels: 1.3150, 1.3120, 1.3110.
Technical Levels: Supports and Resistances
USDCAD currently trading at 1.3168 at the time of writing. Pair opened at 1.3223 and is trading with a change of -0.42 % .
| Overview | Overview.1 | |
|---|---|---|
| 0 | Today last price | 1.3168 |
| 1 | Today Daily Change | -0.0055 |
| 2 | Today Daily Change % | -0.4200 |
| 3 | Today daily open | 1.3223 |
The pair remains strongly bearish on the daily time frame. It trades below the 20 SMA @ 1.3223, 50 SMA 1.3333, 100 SMA @ 1.3451 and 200 SMA @ 1.3476.
| Trends | Trends.1 | |
|---|---|---|
| 0 | Daily SMA20 | 1.3223 |
| 1 | Daily SMA50 | 1.3333 |
| 2 | Daily SMA100 | 1.3451 |
| 3 | Daily SMA200 | 1.3476 |
The previous day high was 1.3226 while the previous day low was 1.3153. The daily 38.2% Fib levels comes at 1.3198, expected to provide resistance. Similarly, the daily 61.8% fib level is at 1.3181, expected to provide resistance.
Note the levels of interest below:
- Pivot support is noted at 1.3175, 1.3128, 1.3102
- Pivot resistance is noted at 1.3249, 1.3274, 1.3322
| Levels | Levels.1 |
|---|---|
| Previous Daily High | 1.3226 |
| Previous Daily Low | 1.3153 |
| Previous Weekly High | 1.3244 |
| Previous Weekly Low | 1.3120 |
| Previous Monthly High | 1.3585 |
| Previous Monthly Low | 1.3117 |
| Daily Fibonacci 38.2% | 1.3198 |
| Daily Fibonacci 61.8% | 1.3181 |
| Daily Pivot Point S1 | 1.3175 |
| Daily Pivot Point S2 | 1.3128 |
| Daily Pivot Point S3 | 1.3102 |
| Daily Pivot Point R1 | 1.3249 |
| Daily Pivot Point R2 | 1.3274 |
| Daily Pivot Point R3 | 1.3322 |
[/s2If]
Download Nehcap EAWe have two EAs that are operational on our LIVE accounts.
- EA-FIX: Check out the details here. Download EA-FIX . EA-FIX is a non-grid HFT scalper.
- EA-GROWTH: High quality low dd EA using trend grids. Download EA_GROWTHJoin Our Telegram Group
")


