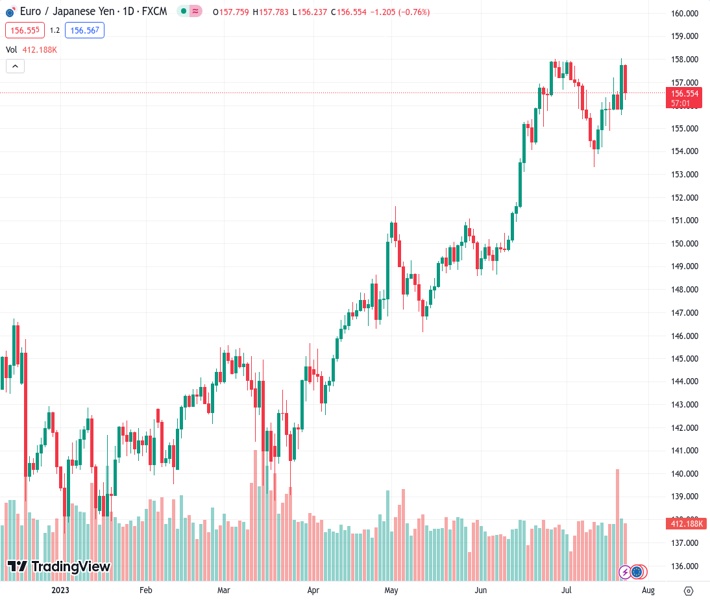
The EURJPY currency pair, currently at a level of 156.542, has decreased substantially from the gains it achieved on Friday. It is now approaching the 156.40 region, which is the 20-day Simple Moving Average (SMA).
…
This is a premium post.
[s2If !current_user_can(access_s2member_level4)]Please register for FREE REGISTER to read full post below containing analysis. In case of any error or you think you are not able to read the full post below, please email us at support#nehcap.com [lwa][/s2If] [s2If current_user_can(access_s2member_level1)]
- EUR/JPY pared most of Friday’s gains, falling towards the 156.40 area (20-day SMA).
The pair currently trades last at 156.542.
The previous day high was 158.05 while the previous day low was 155.59. The daily 38.2% Fib levels comes at 157.11, expected to provide resistance. Similarly, the daily 61.8% fib level is at 156.53, expected to provide support.
During Monday’s session, the EUR/JPY pair traded lower following weak Eurozone PMI data, and German yields decreased ahead of Thursday’s European Central Bank (ECB) decision. On the other hand, Japan reported resilience which made the JPY gain traction.
The Services PMI released by the S&P Global and Hamburg Commercial Bank (HCOB) saw weakness in the primary Eurozone’s Manufacturing and Service sector as they all came in below expectations in July. The French and German Services PMI fell to 52 and 47.4, while the Manufacturing Index dropped to 44.5 and 38.8, respectively, failing to meet expectations. That said, the Eurozone’s PMI plunged to 42.7 while the Services index fell to 51.1, also lower than expected.
Ahead of Thursday’s meeting, the European Central Bank (ECB) tightening expectations have fallen. A 25 basis point hike is largely priced in this week, but according to the World Interest Rate (WIRP) tool, the odds of similar hikes in September, October and December fell to 55%, 70% and 75%, respectively. As a result, German yields continued to decrease. The 2-year yield fell to 3.18% while the 5 and 10-year rates dropped to 2.51% and 2.36%, respectively, with all three seeing more than 2% decreases on the day, making the EUR struggling to find demand in FXs markets.
On the other hand, Japanese PMIs from July showed that the economy is holding resilient in contrast to the economic downturn seen in the region. The Jibun Bank Services PMI released by Markit Economics remained steady at 52.1, while the Manufacturing Index fell slightly to 49.4. Regarding the Bank of Japan’s (BoJ) decision on Friday, markets expect to steady its dovish policy and raise its FY23 core inflation forecast to 2.5%. According to several analysts, the Yield Control Curve (YCC) policy will likely come under scrutiny in October with liftoff to be seen in 2024.
The daily chart analysis indicates a neutral to a bearish outlook in the short term. The Relative Strength Index (RSI) trades in positive territory, but its steep negative slope suggests weakening bullish strength and a potential bearish reversal. The Moving Average Convergence Divergence (MACD) histogram shows red bars, signalling a downward trend, but their gradual fading suggests diminishing bearish pressure. This may open up possibilities for short-term consolidation or a minor bullish retracement.
Resistance levels: 157.00, 157.50, 158.00.
Support level: 156.40 (20-day SMA), 156.00, 155.50.
Technical Levels: Supports and Resistances
EURJPY currently trading at 156.56 at the time of writing. Pair opened at 157.76 and is trading with a change of -0.76 % .
| Overview | Overview.1 | |
|---|---|---|
| 0 | Today last price | 156.56 |
| 1 | Today Daily Change | -1.20 |
| 2 | Today Daily Change % | -0.76 |
| 3 | Today daily open | 157.76 |
The pair remains strongly bullish on the daily timeframe. It trades above its 20 SMA @ 156.42, 50 SMA 153.2, 100 SMA @ 149.3 and 200 SMA @ 146.26.
| Trends | Trends.1 | |
|---|---|---|
| 0 | Daily SMA20 | 156.42 |
| 1 | Daily SMA50 | 153.20 |
| 2 | Daily SMA100 | 149.30 |
| 3 | Daily SMA200 | 146.26 |
The previous day high was 158.05 while the previous day low was 155.59. The daily 38.2% Fib levels comes at 157.11, expected to provide resistance. Similarly, the daily 61.8% fib level is at 156.53, expected to provide support.
Note the levels of interest below:
- Pivot support is noted at 156.22, 154.67, 153.76
- Pivot resistance is noted at 158.68, 159.6, 161.14
| Levels | Levels.1 |
|---|---|
| Previous Daily High | 158.05 |
| Previous Daily Low | 155.59 |
| Previous Weekly High | 158.05 |
| Previous Weekly Low | 154.88 |
| Previous Monthly High | 158.00 |
| Previous Monthly Low | 148.62 |
| Daily Fibonacci 38.2% | 157.11 |
| Daily Fibonacci 61.8% | 156.53 |
| Daily Pivot Point S1 | 156.22 |
| Daily Pivot Point S2 | 154.67 |
| Daily Pivot Point S3 | 153.76 |
| Daily Pivot Point R1 | 158.68 |
| Daily Pivot Point R2 | 159.60 |
| Daily Pivot Point R3 | 161.14 |
[/s2If]
Download Nehcap EAWe have two EAs that are operational on our LIVE accounts.
- EA-FIX: Check out the details here. Download EA-FIX . EA-FIX is a non-grid HFT scalper.
- EA-GROWTH: High quality low dd EA using trend grids. Download EA_GROWTHJoin Our Telegram Group
")


